黄金科学技术 ›› 2023, Vol. 31 ›› Issue (6): 990-1003.doi: 10.11872/j.issn.1005-2518.2023.06.143
刘立刚1,2( ),黄亚旦2()
Ligang LIU1,2(),Yadan HUANG2()
摘要:
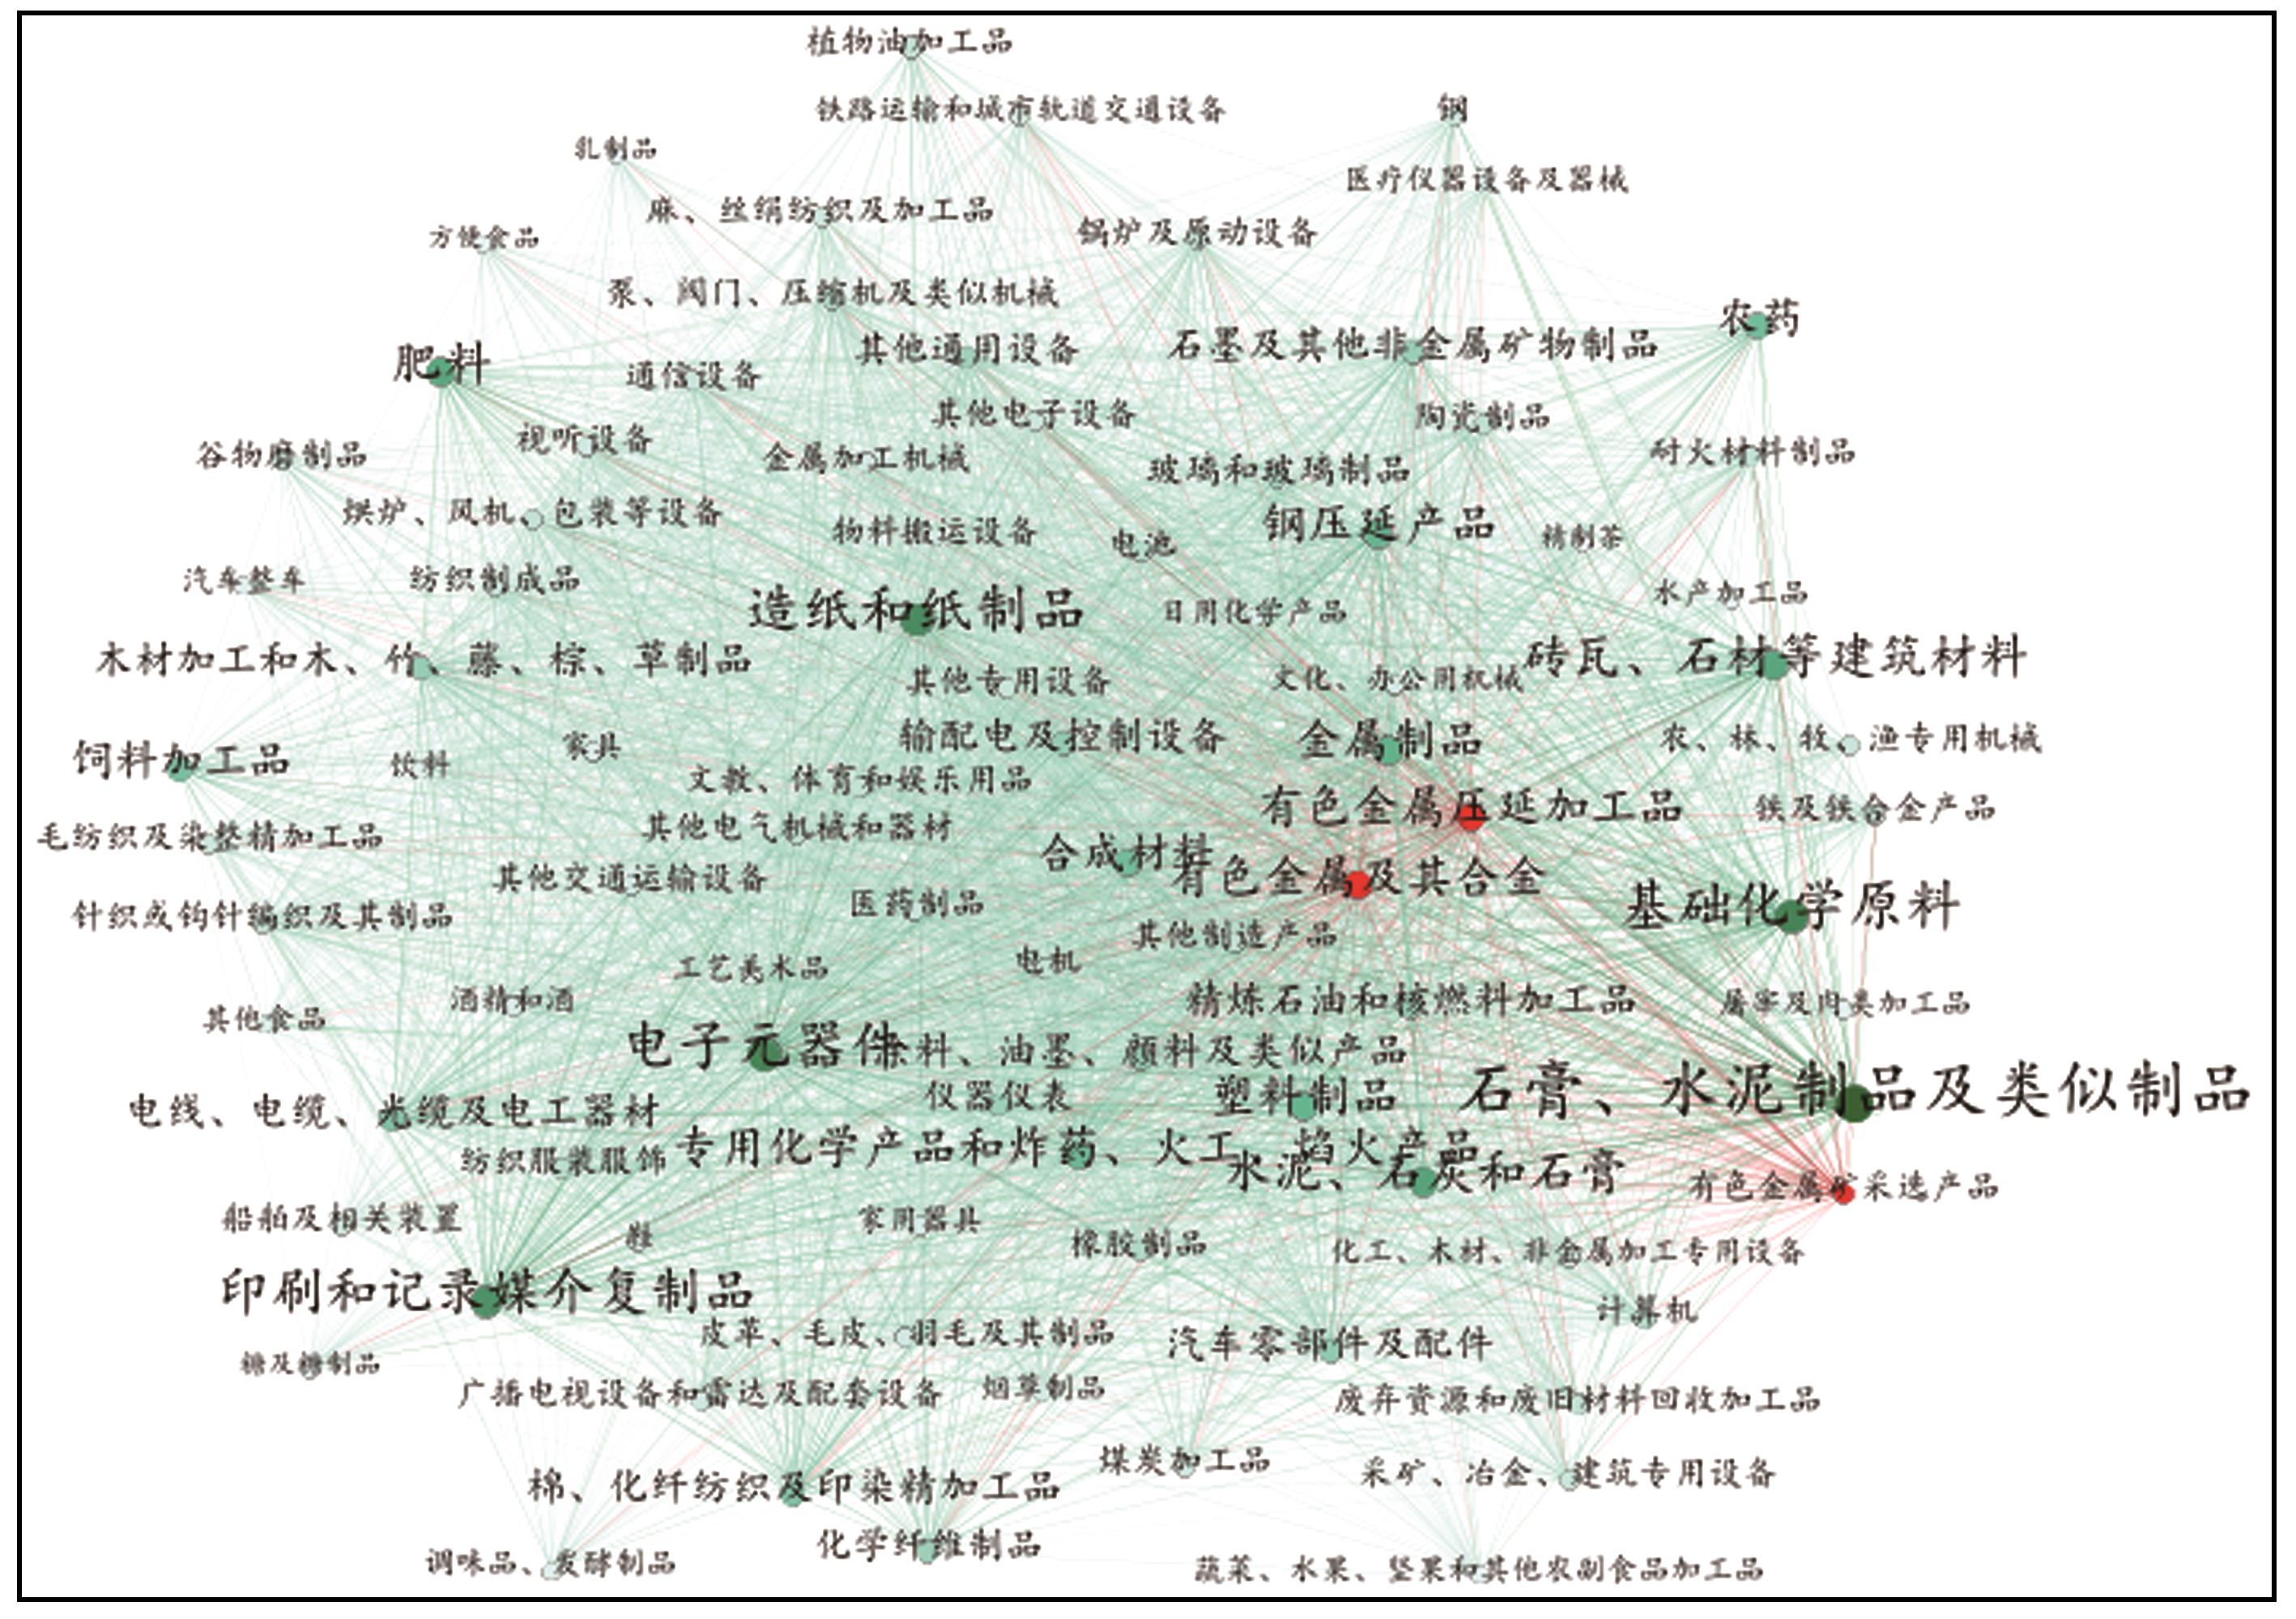
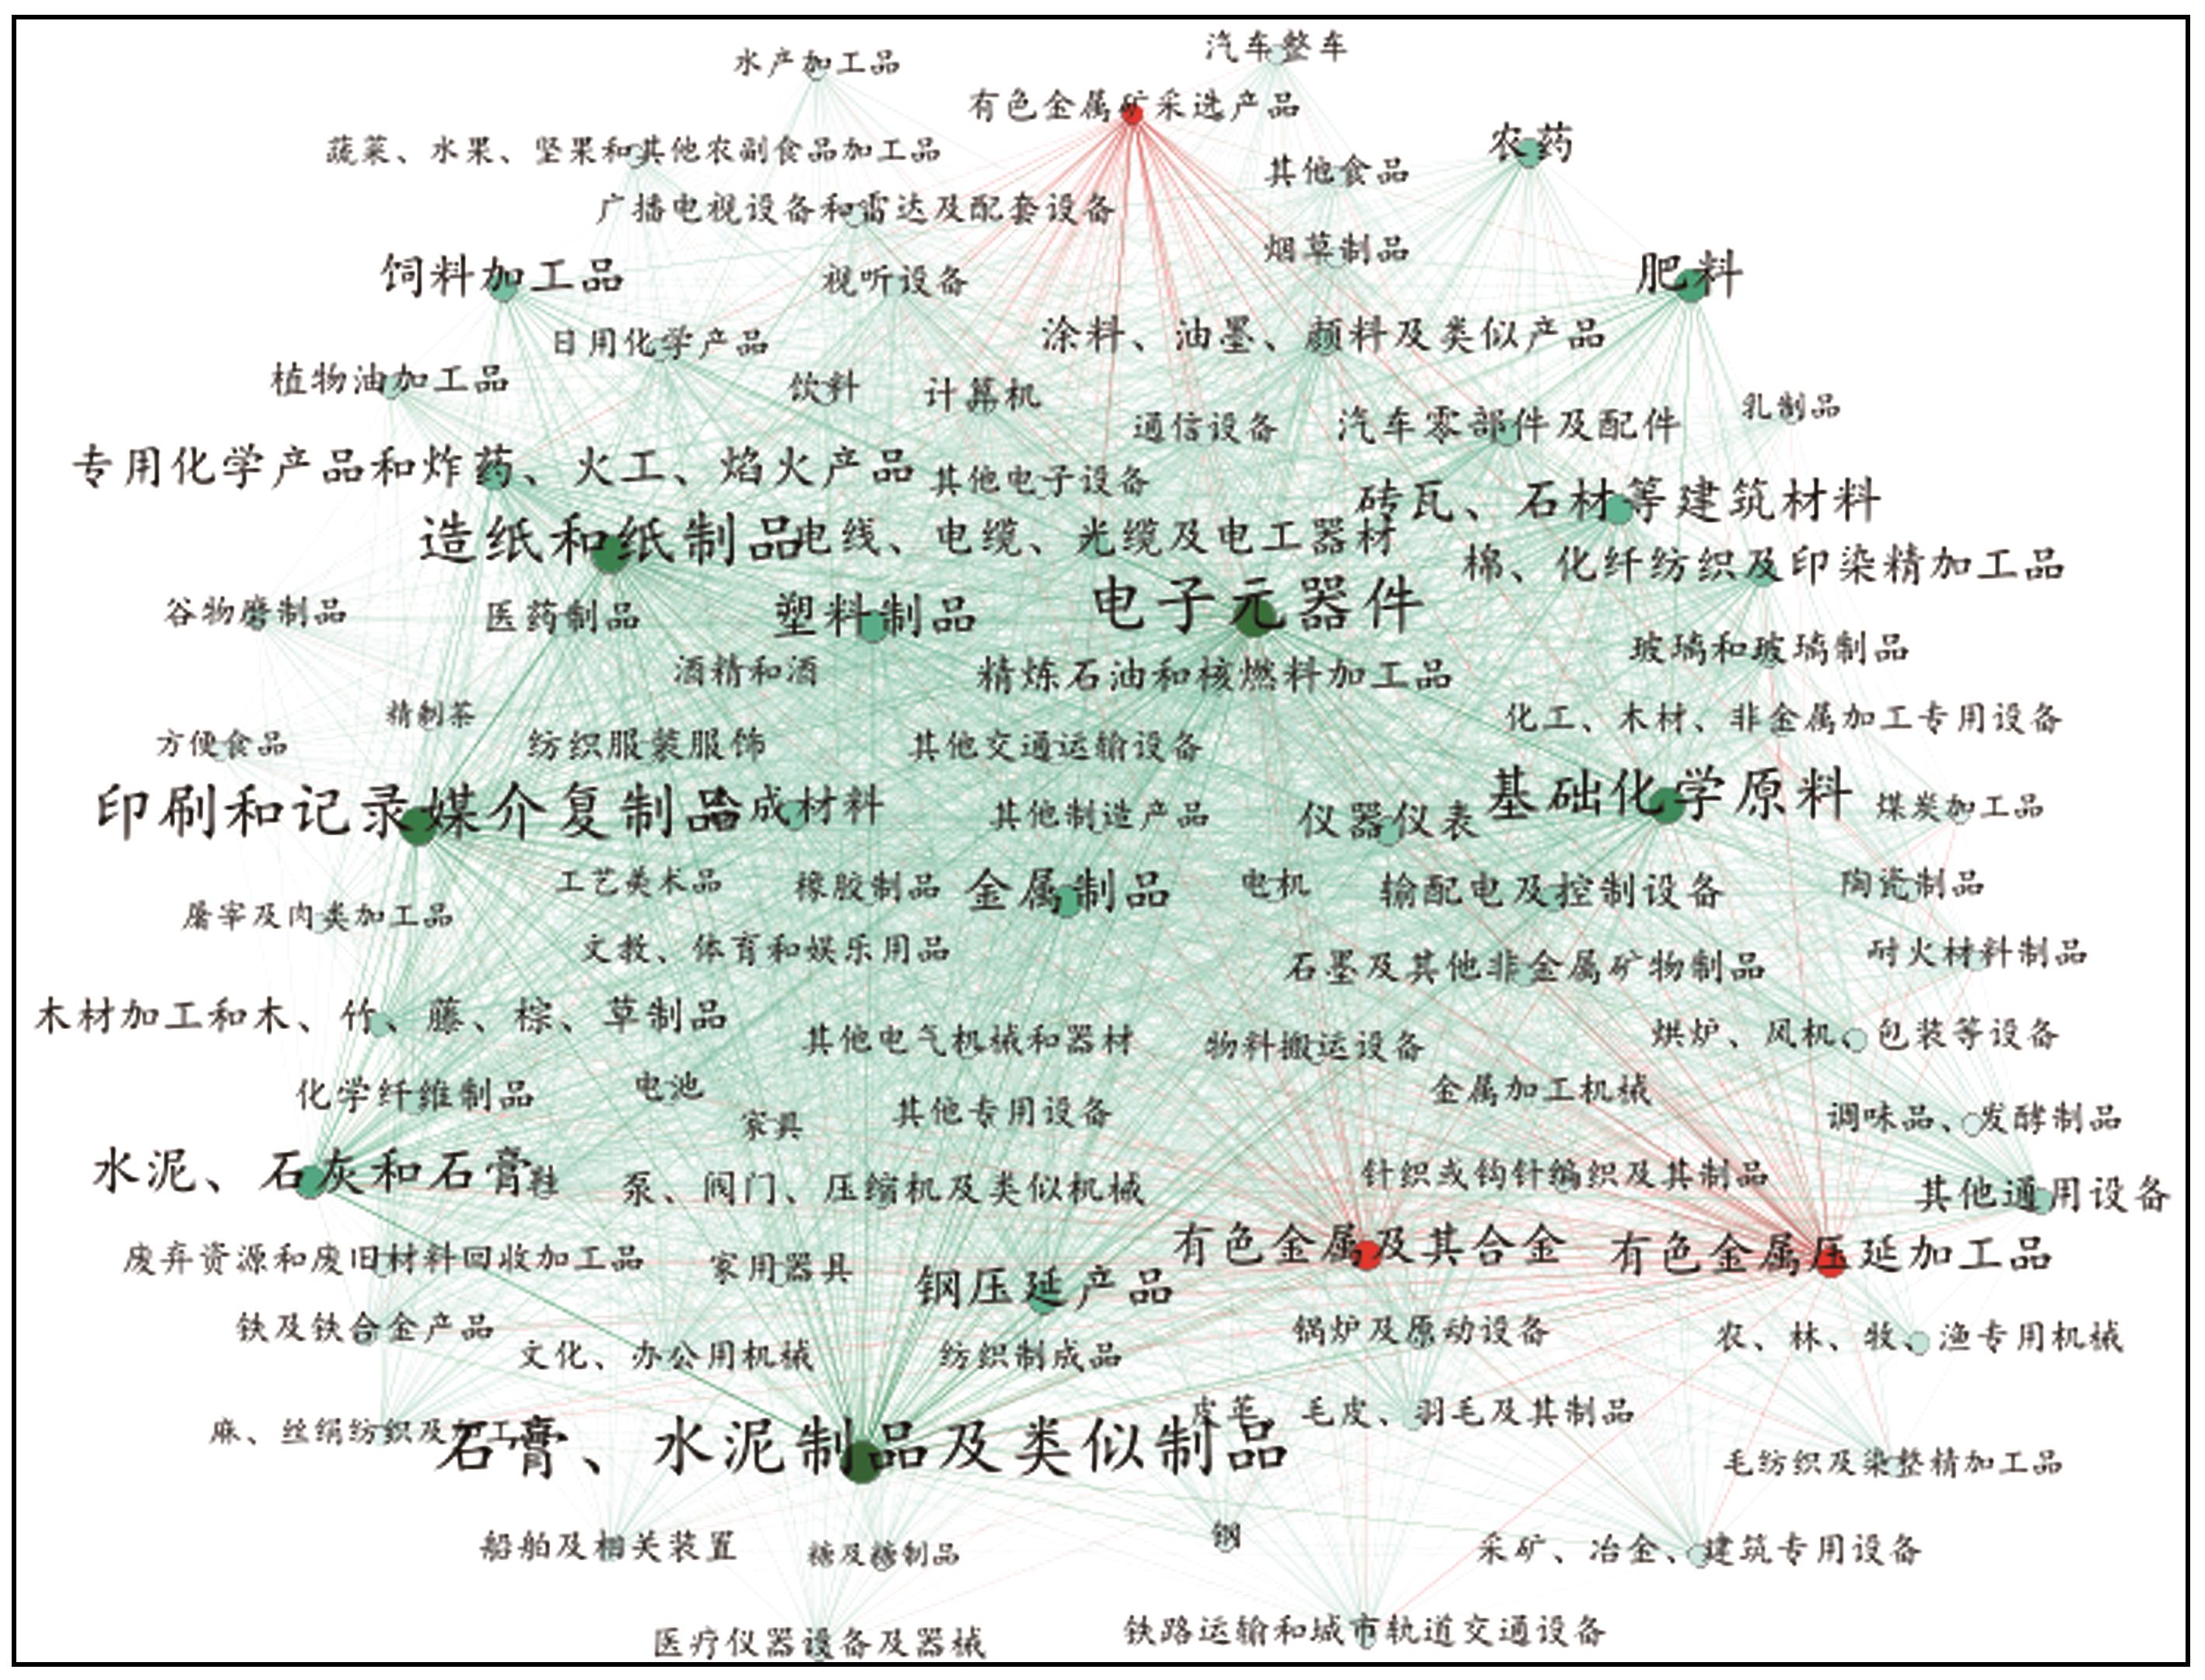
有色金属产业处于整个制造业产业链的最上游,而制造业的发展与国民经济息息相关,因此有色金属产业发展状况如何影响制造业已成为学术界和产业界的重要议题。运用投入产出理论和复杂网络理论,构建了有色金属产业和制造业的产业关联网络,对现阶段我国有色金属产业的关联特征和网络结构进行了相对定量统计,从作用方向、关联程度和网络特征3个方面全面分析我国有色金属产业与制造业的产业关联。研究结果表明:(1)在作用方向上,有色金属产业对下游制造业的前向关联更明显,即推动作用大于拉动作用;(2)在关联程度上,与有色金属产业有较大直接消耗的前10名制造业部门中,有色金属压延加工品部门对输配电及控制设备部门的关联作用最明显;(3)在网络特征上,有色金属产业内部,有色金属矿采选部门的调控能力更强,但缺乏资源的输入输出;有色金属压延加工品部门是有色金属产业的核心部门,对制造业的价值最大;制造业内部,输配电及控制设备的各项指标表现良好,其核心地位处于上升期。
中图分类号:
| An Lei,2020.Research on the Construction and Application of the China 1987—2017 Inter-year Dynamic Input-Output Table[D].Kunming:Yunnan University of Finance and Economics. | |
| Cassi L, Morrison A, Ter Wal A L J,2012.The evolution of trade and scientific collaboration networks in the global wine sector:A longitudinal study using network analysis[J].Economic Geography,88(3):311-334. | |
| Chen Hong,2010.Research on the Contribution of Real Estate Industry to the Development of Local Economy in Jilin Province[D].Changchun:Jilin Institute of Architecture and Engineering. | |
| Chen Menggen, Zhang Xin,2022.A framework of digital economy factor accounting and its application[J].Statistical Research,39(8):3-20. | |
| Ding Hegen,2020.An analysis of China’s media-related industries and their trend based on input-output table[J].Journalism and Communication,27(11):57-75,127. | |
| Fan Jin, Wan Wei, Yuan Xiaohui,et al,2019.Evolution trend and structural decomposition of China’s green value-added during forty years of reform and opening-up[J].Chinese Journal of Population,Resource and Envoronment,29(10):79-89. | |
| Huang Xianhai, Zhu Zhujun,2021.The mechanism and path sele-ction of producer services to promote the high-quality deve-lopment of manufacturing industry[J].Reform,(6):17-26. | |
| Jia Mingxing,2019.A review of nonferrous metals industry achievements in China(1949-2019) and prospects for the future[J].The Chinese Journal of Nonferrous Metals,29(9):1801-1808. | |
| Li Jianjun, Ren Jingyi,2016.Industrial correlation and effect of cultural creative industry:A case study of Shanghai[J].Shanghai Journal of Economics,(11):90-101. | |
| Li Lianyou, Li Bin,2012.The contributions based on the input-output analysis of Beijing culture and creative industry[J].Journal of Central University of Finance and Economics,(6):86-91. | |
| Li Qi, Zheng Minggui, Luo Yuwen,2022.Research on China’s rare earth trade security(1992—2018)—Based on complex network analysis method[J].Chinese Rare Earths,43(1):147-158. | |
| Li Wei, Yang Zijian, Zou Junyi,2009.Accelerating the adjustment of nonferrous metals industry and promoting economic growth[J].Macroeconomic Management,(10):54-55. | |
| Lin Weijian, Zhang Bowen, Wang Weihua,2022.Discussion of materials science development trend through climate change,manufacturing update,national security and materials genome initiative[J].Bulletin of Chinese Academy of Sciences,37(3):336-342. | |
| Liu Bin, Wei Qian, Yue Lü,et al,2016.Servitization of manufacturing and value chain upgrading[J].Economic Research Journal,51(3):151-162. | |
| Liu Mingkai, Zhang Hongyan, Wang Xinyu,2020.Research on the correlation measurement and development path planning of non-ferrous metals industry chain in Guangxi[J].Natural Resource Economics of China,33(12):65-74. | |
| Rui Lun,2020.Driving factors and coordination mechanism for the development of competitive edge of Chinese high-end manufacturing enterprises[J].Journal of Shenzhen University(Humanities and Social Sciences),37(6):83-94. | |
| Ma Ruowei, Zhou Meng, Ding Xin,2023.Options and comparisons for takeover banks in a crisis:From a complex network perspective of interbank market[J].The Theory and Practice of Finance and Economics,44(2):2-8. | |
| Mayhew B H, Levinger R L,1976.Size and the density of interaction in human aggregates[J].American Journal of Sociology,82(1):86-110. | |
| Schiavo S, Reyes J, Fagiolo G,2010.International trade and financial integration:A weighted network analysis[J].Quantitative Finance,10(4):389-399. | |
| Shao Huaming, Ma Yongtan, Zhu Tao,2017.Measurement of stability of stock market and its mechanism:From complex network structure perspective[J].Finance and Economics,(5):54-66. | |
| Si Zengchuo, Wang Xuefeng,2015.Industry relevancy evolution and key path identification in commercial circulation industry development:Case study on China’s hotel and catering industry[J].Journal of Business Economics,(2):18-26. | |
| Sun Yanan, Liu Huajun, Liu Chuanming,et al,2016.Research on spatial association of provinces carbon emissions and its effects in China[J].Shanghai Journal of Economics,(2):82-92. | |
| Wang Tong’an,2014.Research on the general feature of Chinese industrial structure based on social network analysis[J].Science Research Management,35(7):124-129. | |
| Wu Yiding, Chen Cheng,2013.Study on financial characteristics and risk sources of nonferrous metals industry[J].Com-munication of Finance and Accounting,(14):120-122. | |
| Xia Ming, Zhang Hongxia,2013. Input-Output Analysis—Theories,Methods and Applications[M].Beijing:China Renmin University Press. | |
| Xing Lizhi,2012.Analysis of regional industrial structure model based on complex networks theory[J].Journal of Industrial Technological Economics,31(2):19-29. | |
| Xu Xianchun, Liu Qiyun,2002.Input-Output Theory and Practice in China[M].Beijng:China Statistics Press. | |
| Xuan Siyuan, Yu Yongze,2021.Biased development,fiscal decentralization and the delayed development of producer services in China[J].Forum of World Economics and Politics,(4):146-172. | |
| Xun Yang, Huang Qian, Cao Meijuan,et al,2022.The impact of COVID-19 on and the post-pandemic high-quality development of sports industry from the perspective of industrial relevance structure[J].Journal of Chengdu Sport University,48(1):64-72. | |
| Yang Jin, Xie Ruolin,2020.Research on the key factors and path of transformation and upgrading of equipment manufacturing industry driven by disruptive innovation[J].Forum on Science and Technology in China,(11):74-82,109. | |
| Yuan Xiaofeng, Gui Weihua, Chen Xiaofang,et al.,2018.Transforming and upgrading nonferrous metal industry with artificial intelligence[J].Strategic Study of Chinese Academy of Engineering,20(4):59-65. | |
| Zhang Hao,2021.Study on the correlation effect of China’s nonferrous metals industry[J].World Nonferrous Metals,(13):176-177. | |
| Zhao Bingxin, Zhang Jianghua,2013.Introduction to Industrial Network Theory[M].Beijing:Economic Science Press. | |
| Zhao Jingwen,2017.Analysis of the Linkage Effect of Yunnan Nonferrous Metals Industry[D].Kunming:Yunnan University of Finance and Economics. | |
| Zhao Jingwen, Liu Chunxue, Zhang Qinli,2017.Analysis of the correlation degree and influence of nonferrous metal industry in Yunnan Province[J].China Mining Magazine,26(2):66-70. | |
| Zhao Zhe, Zeng Chen, Cheng Yijiao,2020.The spillover effect of traffic network on intensive land use:A case study in Beijing-Tianjin-Hebei urban agglomeration[J].Economic Geography,40(7):174-183. | |
| Zhou Dapeng,2021.Research on the influence of servitization on overseas M&A of Chinese enterprises under the new development pattern[J].World Economy Studies,(8):107-119,137. | |
| 安蕾,2020.中国1987—2017年度间动态投入产出表的编制及应用[D].昆明:云南财经大学. | |
| 陈红,2010.房地产业对吉林省地方经济发展贡献研究[D].长春:吉林建筑工程学院. | |
| 陈梦根,张鑫,2022.数字经济要素投入核算框架及应用研究[J].统计研究,39(08):3-20. | |
| 丁和根,2020.我国传媒产业关联及其演化趋势分析——基于投入产出表的实证研究[J].新闻与传播研究,27(11):57-75,127. | |
| 范金,万伟,袁小慧,等,2019.改革开放40年中国绿色增加值演化趋势与结构分解[J].中国人口·资源与环境,29(10):79-89. | |
| 黄先海,诸竹君,2021.生产性服务业推动制造业高质量发展的作用机制与路径选择[J].改革,(6):17-26. | |
| 贾明星,2019.七十年辉煌历程 新时代砥砺前行——中国有色金属工业发展与展望[J].中国有色金属学报,29(9):1801-1808. | |
| 李建军,任静一,2016.文化创意产业的产业关联与波及效应研究——基于上海市投入产出表的实证分析[J].上海经济研究,(11):90-101. | |
| 李连友,李宾,2012.基于投入产出方法的北京市文化创意产业对经济贡献分析[J].中央财经大学学报,(6):86-91. | |
| 李期,郑明贵,罗宇文,2022.中国稀土贸易安全研究(1992—2018)——基于复杂网络分析方法[J].稀土,43(1):147-158. | |
| 李威,杨子健,邹俊义,2009.加快有色金属产业调整 促进经济增长[J].宏观经济管理,(10):54-55. | |
| 林伟坚,张博文,汪卫华,2022.从全球气候变化、制造业产业升级、国家安全及材料基因工程维度探讨材料科学发展趋势[J].中国科学院院刊,37(3):336-342. | |
| 刘斌,魏倩,吕越,等,2016.制造业服务化与价值链升级[J].经济研究,51(3):151-162. | |
| 刘明凯,张红艳,王新宇,2020.广西有色金属产业链关联测度与发展路径规划研究[J].中国国土资源经济,33(12):65-74. | |
| 伦蕊,2020.中国高端制造企业竞争力生成的驱动因素与协同机制[J].深圳大学学报(人文社会科学版),37(6):83-94. | |
| 马若微,周萌,丁鑫,2023.危机时接管银行的选择与比较——基于银行间市场复杂网络模型的研究[J].财经理论与实践,44(2):2-8. | |
| 邵华明,马永谈,朱涛,2017.股票市场稳定性测度及其作用机制——基于复杂网络模型视角的分析[J].财经科学,(5):54-66. | |
| 司增绰,王雪峰,2015.商贸流通业成长的产业关联演变与关键路径识别——以我国住宿和餐饮业为例的研究[J].商业经济与管理,(2):18-26. | |
| 孙亚男,刘华军,刘传明,等,2016.中国省际碳排放的空间关联性及其效应研究——基于SNA的经验考察[J].上海经济研究,(2):82-92. | |
| 王铜安,2014.基于社会网络视角的产业结构总体特征研究[J].科研管理,35(7):124-129. | |
| 吴一丁,陈成,2013.有色金属行业财务特征分析及风险源研究[J].财会通讯,(14):120-122. | |
| 夏明,张红霞,2013.投入产出分析——理论、方法与数据[M].北京:中国人民大学出版社. | |
| 邢李志,2012.基于复杂网络理论的区域产业结构网络模型研究[J].工业技术经济,31(2):19-29. | |
| 许宪春,刘起运,2002.中国投入产出理论与实践[M].北京:中国统计出版社. | |
| 宣思源,余泳泽,2021.偏向型开放、财政分权与中国生产性服务业发展滞后[J].世界经济与政治论坛,(4):146-172. | |
| 荀阳,黄谦,曹美娟,等,2022.冲击解析及应对:新冠疫情影响下的体育产业高质量发展研究——基于产业关联结构的视角[J].成都体育学院学报,48(1):64-72. | |
| 杨瑾,解若琳,2020.颠覆式创新驱动装备制造业转型升级的关键影响因素及路径[J].中国科技论坛,(11):74-82,109. | |
| 袁小锋,桂卫华,陈晓方,等,2018.人工智能助力有色金属工业转型升级[J].中国工程科学,20(4):59-65. | |
| 张昊,2021.中国有色金属产业关联效应研究[J].世界有色金属,(13):176-177. | |
| 赵炳新,张江华,2013.产业网络理论导论[M].北京:经济科学出版社. | |
| 赵婧雯,2017.云南有色金属产业联动效应分析[D].昆明:云南财经大学. | |
| 赵婧雯,刘春学,张钦礼,2017.云南有色金属产业关联程度及影响分析[J].中国矿业,26(2):66-70. | |
| 赵哲,曾晨,程轶皎,2020.交通路网的空间外溢性对土地集约利用的影响——以京津冀城市群为例[J].经济地理,40(7):174-183. | |
| 周大鹏,2021.新发展格局下制造业服务化对中国企业海外并购的影响研究[J].世界经济研究,(8):107-119,137. |
| [1] | 朱文兴,胡恒祺,徐水太. 全球稀有矿产品贸易格局演化及我国供应安全研究[J]. 黄金科学技术, 2022, 30(6): 877-890. |
| [2] | 刘贻玲,郑明贵. 中国有色金属产业结构升级演进研究[J]. 黄金科学技术, 2022, 30(4): 632-640. |
| [3] | 徐水太, 马彩薇, 朱文兴. “一带一路”稀土贸易网络结构及演化研究[J]. 黄金科学技术, 2022, 30(2): 196-208. |
| [4] | 许礼刚,王妤歆,关景文. 产业链安全视阈的稀土资源开发负外部性反哺机制研究[J]. 黄金科学技术, 2019, 27(4): 609-620. |
|
©2018 黄金科学技术编辑部
电话:0931-8277791
E-mail: hjkx@lzb.ac.cn 邮编:730000


 甘公网安备 62010202000672号