


2015年,习近平在中央财经领导小组会议上指出要着力加强供给侧结构性改革(以下称“供给侧改革”)。作为战略性与基础原材料的有色金属产业,在深化改革开放30年来已取得长足发展,但产业结构升级效果如何,尤其是在供给侧改革前后的升级效果如何,值得关注。为了更好地理解1986年“七五”计划以来中国有色金属产业结构的升级过程及效果,本研究在梳理已有文献的基础上,参考郭朝先等(2018)提法,将中国有色金属产业发展历程划分为4个阶段:第一阶段为产量追赶(1986—2001年),第二阶段为规模快速扩张(2002—2011年),第三阶段为转型发展(2012—2015年),第四阶段为高质量发展(2016—2019年)。然后运用产业结构超前系数、Moore结构变化值、产业结构年均变动值和产业结构升级高度值构建了反映有色金属产业结构升级方向、速率和程度的测算模型,并对4个阶段尤其第三、四阶段供给侧改革前后的升级效果进行了对比分析。
1 研究现状
1.1 产业结构升级内涵研究
1941年,利用产业比例变化度量产业结构升级的库兹涅茨法则最先提出。20世纪90年代,学术界开始基于企业战略理论和产业价值链学说开展产业结构升级的系统研究。Shin et al.(1997)和Gereffi(1999)基于企业微观视角,认为原材料供给、市场和科技需求以及政策等内外部因素驱动了产业升级,改变了产业的市场分布和定位,同时优化了产业结构比例。随后,Teece et al.(1997)和Ashida et al.(2010)基于全球价值链视角研究产业结构升级,吴崇伯(1988)探讨了东盟各国产业升级背景、问题及前景。20世纪90年代之后,学者们更多地关注产业结构升级问题。国内对产业结构升级的研究大多从区域和行业角度进行。基于区域的产业结构升级,主要聚焦于某一地区3次产业比例和格局由低级向高级演进问题(谭晶荣等,2012);基于行业的产业结构升级,既有产业间也有价值链间的升级,即产业整体从低技术向高技术水平、低附加值向高附加值状态演进,例如符瑛(2016)、付珊娜等(2017)和郭晓蓓(2019)认为制造业产业结构升级倾向资本和技术集中化并伴随着价值链提升。
综上所述,研究人员从不同角度对产业结构升级内涵进行的分析可归纳为2个层面:一是区域的产业结构升级,如某地区从第一产业为主导向第二、第三产业演变;二是行业的产业结构升级,主要指同一行业内实现工艺(技术)、产品、功能和价值链的升级。从产业链来看,有色金属产业一般包括采选业(前端)、冶炼及压延加工业(后端),而后端应用不包括在内,分析前后端产业结构升级和价值链提升对后端应用意义重大。本研究基于行业的产业结构升级,分别对产业前后端的升级效果进行分析。
1.2 产业结构升级测算方法研究
Kuznets(1973)和Kaldor(1961)提出用劳动力在各个产业间的转移测定产业结构升级速度。在测算方法上,部分研究采用产业结构超前系数法、Lilien指数法和Moore结构变化值法。如刘志彪等(2002)运用Moore结构变化值法测算了1978—1990年、1990—1999年中国产业结构水平,认为Moore结构变化值法能够更细致、灵敏地揭示产业结构变化的过程。吴文洁等(2018)和李宇佳等(2019)也使用该方法进行了产业结构升级研究。马洪福等(2017)运用产业结构超前系数、Lilien指数和Moore结构变化值法分别测算了某一地区3次产业结构升级方向和速率。也有学者利用产业结构高度化值衡量升级程度,测算方法为指标法(刘伟等,2008),还有学者利用指标体系研究产业结构升级问题(李慧等,2017)。
从以上文献来看,产业结构升级定量测算包括方向、速率和程度3个方面,并有相应的测算方法。这为本文开展有色金属产业结构升级测算提供了思路和方法。由此,本文选用产业结构超前系数测算升级方向,Moore结构变化值和产业结构年均变动值测算升级速率,产业结构升级高度值测算升级程度。
1.3 有色金属产业结构研究
国外对有色金属产业结构的研究侧重于产业整合与结构升级,总体来看,基于企业微观视角的研究成果较多,而基于中观和宏观视角的研究成果较少。产业整合聚焦于企业并购,包括产业整合的内涵研究(Tommelein et al.,1999;Kaplinsky et al.,2000)和对策研究(Tommelein,1998;Sinding,2009)。产业结构升级方面,Miller(1998)和Myers(1984)围绕企业技术和产品创新等问题进行研究,得出有色金属产业核心竞争力提升的路径。
国内学者主要聚焦于有色金属产业链研究(王克岭等,2009),尚未有学者系统研究有色金属产业结构升级的测量问题。另外,定性研究与综合评价行业发展效率的成果较多,如刘兆顺等(2006)利用Shift-share方法对吉林省矿业发展现状进行分析和评价;郑明贵等(2012)利用DEA模型评价中国有色金属工业总体经济效益;王朗等(2013)基于动态偏离份额模型,利用就业人数分析产业结构;袁小锋等(2018)和刘贻玲等(2021)研究有色金属产业转型升级问题。
本文的主要创新和贡献在于:一是基于产业链视角,构建有色金属产业结构升级效果测算模型,拓展了产业结构升级测算思路和方法;二是以1986—2019年数据为样本,研究有色金属产业4个阶段的升级方向、速率和程度,以更好地理解30年来中国有色金属产业结构升级的演进过程,为深化供给侧改革和未来政策制定提供依据。
2 测算模型
2.1 升级方向测算模型
利用产业结构超前系数(马洪福等,2017)测算有色金属产业结构升级方向,计算公式为
式中:
若
2.2 升级速率测算模型
(1)Moore结构变化值
Moore结构变化值是将产业分为
式中:
定义向量(产业份额)之间变化的总夹角为
式中:
(2)产业结构年均变动值
基于
式中:
2.3 升级程度测算模型
考虑劳动生产率这一思想测算产业结构升级的高度值(刘伟等,2008),利用该指标衡量产业结构升级程度,测算公式为
式中:
式中:
3 实证分析
3.1 基本数据统计分析
(1)主营业务收入统计分析
通过数据整理得到有色金属采选业、冶炼及压延加工业的主营业务收入及其占产业比重,并分别计算各阶段的平均增长率,见表1。
表1 1986—2019年有色金属产业主营业务收入分阶段统计
Table 1
| 产业类型 | 指标 | 1986—2001年 | 2002—2011年 | 2012—2015年 | 2016—2019年 |
|---|---|---|---|---|---|
| 采选业 | 平均值/亿元 | 209.61 | 1 619.57 | 6 095.07 | 4 440.11 |
| 占产业比重平均值/% | 17.84 | 11.81 | 11.31 | 7.67 | |
| 平均增长率/% | 16.75 | 28.86 | 6.05 | -23.86 | |
| 冶炼及压延加工业 | 平均值/亿元 | 965.04 | 12 090.99 | 47 784.68 | 53 417.11 |
| 占产业比重平均值/% | 82.16 | 88.19 | 88.69 | 92.33 | |
| 平均增长率/% | 18.48 | 32.2 | 8.64 | 1.66 | |
| 有色金属产业 | 平均值/亿元 | 1 174.65 | 13 710.56 | 53 879.75 | 57 857.23 |
| 平均增长率/% | 18.2 | 31.76 | 8.35 | -0.51 |
由表1可知,采选业主营业务收入平均值在前3个阶段持续增加,第四阶段出现下降;主营业务收入占产业比重逐年下降;主营业务收入平均增长率在第二阶段有较大增幅,第三阶段降幅明显,供给侧改革后由正转负。可见前端产能得到了有效控制,改革较显著。
此外,冶炼及压延加工业主营业务收入平均值4个阶段均持续上升;主营业务收入占产业比重在各阶段逐步增加,产业结构升级朝着供给侧改革目标方向发展;主营业务收入平均增长率前2个阶段增长快,后2个阶段增长慢,可见后端调整基本到位,转向高质量方向发展。
总体来看,有色金属产业主营业务收入平均值整体呈现快速增长趋势;主营业务收入平均增长率第二阶段有较大增幅,第三、四阶段均有所下滑,尤其供给侧改革后下降明显。
(2)用工人数统计分析
有色金属采选业、冶炼及压延加工业的用工人数如表2所示。
表2 1986—2019年有色金属产业用工人数分阶段统计
Table 2
| 产业类型 | 指标 | 1986—2001年 | 2002—2011年 | 2012—2015年 | 2016—2019年 |
|---|---|---|---|---|---|
| 采选业 | 平均值/万人 | 65.98 | 42.53 | 52.93 | 36.76 |
| 阶段平均增长率/% | 0 | -35.54 | 24.45 | -30.55 | |
| 冶炼及压延加工业 | 平均值/万人 | 105.83 | 130.28 | 200.16 | 187.44 |
| 阶段平均增长率/% | 0 | 23.10 | 53.64 | -6.35 | |
| 有色金属产业 | 平均值/万人 | 171.81 | 197.4 | 253.09 | 224.20 |
| 阶段平均增长率/% | 0 | 14.89 | 28.21 | -11.41 |
由表2可知,采选业用工人数平均值在第一阶段最高,第四阶段最低;用工人数平均增长率第一至第二阶段上升,第三阶段开始负增长,且供给侧改革后下降明显。此外,冶炼及压延加工业用工人数平均值前3个阶段持续增加,第四阶段出现下降;用工人数平均增长率随有色金属产业规模扩张而增加,即第一至第二阶段上升,第三、四阶段持续下降,且第四阶段负增长。总体来看,前3个阶段有色金属产业用工人数平均值增加,第四阶段有所下降;采选业平均增长率在各阶段均比冶炼及压延加工业下降更快,且第四阶段的平均增长率明显下滑,说明第四阶段着力推进供给侧结构性改革,由重视数量增长和规模扩张转变为更加重视质量提高和效益提升。
(3)劳动生产率统计分析
利用
表3 1986—2019年有色金属采选业、冶炼及压延加工业劳动生产率分阶段统计
Table 3
| 阶段 | 年份 | 劳动生产率/(万元/人) | 阶段 | 年份 | 劳动生产率/(万元/人) | ||
|---|---|---|---|---|---|---|---|
| 采选业 | 冶炼及压延加工业 | 采选业 | 冶炼及压延加工业 | ||||
| 第一阶段 | 1986 | 0.71 | 2.22 | 第二阶段 | 2004 | 18.68 | 46.5 |
| 1987 | 0.85 | 2.42 | 2005 | 26.75 | 60.01 | ||
| 1988 | 1.06 | 2.93 | 2006 | 37.85 | 93.9 | ||
| 1989 | 1.26 | 3.45 | 2007 | 40.63 | 114.65 | ||
| 1990 | 1.36 | 3.4 | 2008 | 50.55 | 111.6 | ||
| 1991 | 1.42 | 4.12 | 2009 | 57.13 | 118.22 | ||
| 1992 | 1.66 | 5.06 | 2010 | 69.24 | 152.28 | ||
| 1993 | 2.43 | 6.58 | 2011 | 92.35 | 191.41 | ||
| 1994 | 3.12 | 7.81 | 平均 | 41.65 | 94.66 | ||
| 1995 | 3.82 | 10.63 | 第三阶段 | 2012 | 107.49 | 223.8 | |
| 1996 | 4.12 | 10.14 | 2013 | 111.92 | 230.31 | ||
| 1997 | 4.85 | 11.34 | 2014 | 116.91 | 245.6 | ||
| 1998 | 5.57 | 13.67 | 2015 | 124.95 | 253.77 | ||
| 1999 | 6.24 | 16.04 | 平均 | 115.32 | 238.37 | ||
| 2000 | 7.72 | 19.75 | 第四阶段 | 2016 | 138.91 | 273.19 | |
| 2001 | 8.65 | 20.68 | 2017 | 128.86 | 248.72 | ||
| 平均 | 3.43 | 8.77 | 2018 | 110.99 | 310.44 | ||
| 第二阶段 | 2002 | 9.98 | 24.89 | 2019 | 93.75 | 320.01 | |
| 2003 | 13.3 | 33.16 | 平均 | 118.13 | 288.09 | ||
由表3可知:(1)采选业4个阶段劳动生产率平均值持续增加,且第二阶段劳动生产率平均值较第一阶段增加了11.14倍,第三阶段较第二阶段增加了1.77倍,转型发展期增幅放缓,第四阶段较第三阶段增加了0.02倍,可见采选业劳动生产率增长趋于迟缓。(2)冶炼及压延加工业4个阶段劳动生产率平均值呈快速上升趋势。第一阶段平均值较第二阶段增加了9.79倍,第三阶段较第二阶段增加了1.52倍,第四阶段较第三阶段增加了0.21倍,冶炼及压延加工业劳动生产率增长也达到一定高度并趋于稳定。
3.2 产业结构升级方向分析
利用
表4 1986—2019年有色金属产业超前系数
Table 4
| 产业类型 | 超前系数 | ||||
|---|---|---|---|---|---|
| 采选业 | 1.0596 | 0.5642 | 0.1937 | -0.2806 | 0.6544 |
| 冶炼及压延加工业 | 0.9870 | 1.0952 | 1.1762 | 1.2898 | 1.0767 |
由表4可知,采选业4个阶段产业超前系数持续下降,尤其供给侧改革后超前系数为负数,显示采选业份额正逐步降低,表明有色金属产业前端过度发展得到了有效抑制,改革取得积极效果。同时,冶炼及压延加工业超前系数在第一阶段趋向于1,第二、三、四阶段均大于1,表明有色金属产业后端超前发展,所占份额呈上升趋势。
总体来看,第一阶段采选业产业结构超前系数略高于冶炼及压延加工业,即前端略高于后端;后3个阶段,冶炼及压延加工业超前系数远大于采选业,显示有色金属产业总体由前端向后端方向升级。
3.3 产业结构升级速率分析
根据
图1
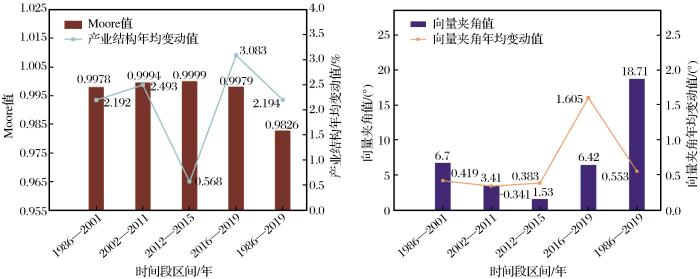
图1
1986—2019年有色金属产业结构(a)和向量夹角(b)变化速率
Fig.1
Change rate of nonferrous metal industrial structure(a)and vector angle(b) from 1986 to 2019
由图1可知:(1)有色金属产业Moore结构变化值在4个阶段差别不大,均趋向于1,因此需要结合向量夹角值
3.4 产业结构升级程度分析
依据
图2
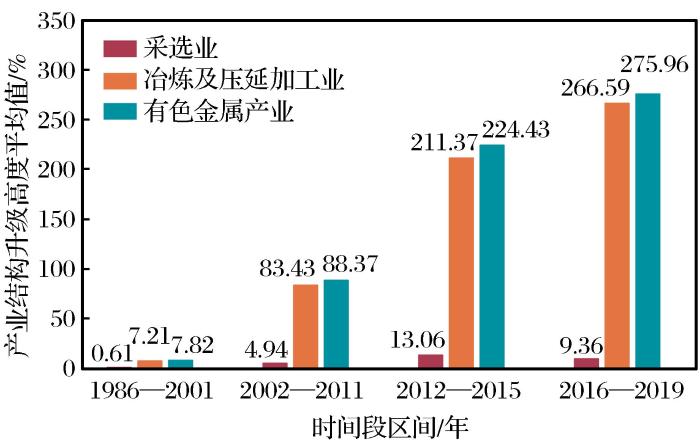
图2
1986—2019年有色金属产业结构升级高度平均值
Fig.2
Average value of upgrading height of nonferrous metal industrial structure from 1986 to 2019
由图2可知:(1)采选业升级高度平均值在前3个阶段持续上升,第四阶段略有降低,反映有色金属产业前端正在动态调整。(2)冶炼及压延加工业产业升级高度平均值在4个阶段呈持续增长趋势,反映有色金属产业后端升级程度明显上升,并向着更高层次发展。(3)总体来看,有色金属产业结构升级高度值持续上升,升级程度由低级阶段向高级阶段演变,正朝着供给侧改革目标方向发展。
4 结论与启示
4.1 结论
通过对中国有色金属产业结构升级进行研究,基于中国有色金属产业1986—2019年数据,构建了反映有色金属前后端产业结构升级方向、速率和程度的测算模型,观测4个阶段产业结构升级演进情况,对比了供给侧改革前后的升级效果,得出以下结论:(1)供给侧改革后有色金属采选业过度发展得到了有效抑制,有色金属产业总体由低附加值向高附加值方向升级;(2)30年来有色金属产业结构升级总体上处于优化提升的过程,供给侧改革效果显著;(3)有色金属采选业前端正在改革调整,冶炼及压延加工业后端升级程度急速上升,并向着更高层次发展。
4.2 启示
通过分析,结合中国有色金属产业结构升级实际情境,提出如下研究启示:(1)从产业升级方向来看,需强化市场去产能机制,采取有效措施加快冶炼及压延加工业转型升级,这对于后端应用意义重大。(2)从产业升级速率来看,应坚持以需求为导向,加快推进产能置换和淘汰落后产能,提高劳动生产率,提升加工企业快速、低成本满足用户需求的能力;加强急缺矿种海外资源开发力度,为国内供给侧改革提供更加充裕的时间。(3)从产业升级程度来看,应加强科技创新,提高精深加工水平,提高产品质量、科技含量;注重工艺转向智能化、柔性化、精细化及绿色化。
http://www.goldsci.ac.cn/article/2022/1005-2518/1005-2518-2022-30-4-632.shtml
参考文献
Introduction:Globalization,value chains and development
[J].
The research status and prospects of manufacturing industrial upgrading
[J].
Study on influencing factors of transformation of industrial clusters under the Global Value Chain Upgrading
[J].
International trade and industrial upgrading in the apparel commodity chain
[J].
Review of the development of China’s nonferrous metals industry in the past 40 years of reform and opening up and the way of high quality development in the future
[J].
The impact research of environmental regulations on the structural upgrading of manufacturing industry—Analysis on path and panel data model
[J].
Capital Accumulation and Economic Growth
[M]//Lutz F A,Hague D C.
Modern economic growth:Findings and reflections
[J].
Measurement on industrial structure upgrade of China’s equipment manufacturing industry
[J].
Study on the linkage and structural upgrading of forestry industry in Beijing
[J].
A study of industrial structure degree,industrialization process and regional difference in China
[J].
Evaluation of upgrading effect of ferrous and non-ferrous metal mining industry structure based on the structural reform of supply-side
[J].
Analysis and adjustment of mining industry structure in Jilin Province
[J].
China’s industrial structural evalution and economic increase
[J].
The measurement of industrial transformation and upgrading level and its influence on labor productivity—Taking 26 cities in the middle reaches of Yangtze River as an example
[J].
The modigliani-miller propositions after thirty years
[J].
The capital structure puzzle
[J].
Industrial transformation:Interactive decision-making process in creating a global industry (Korea’s Electronics Industry)
[J].
Consolidation,fragmentation and the structure of the mining industry
[J].
Measurement of the level of industrial upgrading and the assessment of affecting factors of labor productivity—A case study of 16 cities in Yangtze River Delta Region
[J].
Dynamic capabilities and strategic management
[J].
Pull-driven scheduling for pipe-spool installation:Simulation of lean construction technique
[J].
More just-in-time:Location of buffers in structural steel supply and construction Processes
[C]//
Research on sustainable development of non-fetus metals industry of Yunnan Province based on the perspective of industry chain
[J].
Dynamic shift share analysis on industrial structure of Inner Mongolia’s mining industry
[J].
On the industrial upgrading of ASEAN countries
[J].
A study on the influence of industrial structure evolution on the total factor energy efficiency
[J].
Transforming and upgrading nonferrous metal industry with artificial intelligence
[J].
Overall economic benefit assessment on China’s nonferrous metal industry based on DEA model
[J].
全球价值链视角下我国产业集群转型升级影响因素研究
[J].
制造业产业升级的研究回顾与展望
[J].
改革开放四十年我国有色金属工业发展回顾与未来高质量发展之路
[J].
环境规制对制造业结构升级的影响研究——基于路径分析与面板数据模型检验
[J].
装备制造业产业结构升级程度测量
[J].
北京市林业产业关联和结构升级研究
[J].
中国产业结构高度与工业化进程和地区差异的考察
[J].
基于供给侧结构性改革的黑色和有色金属矿业产业结构升级效果评价
[J].
吉林省矿业产业结构分析与产业结构调整
[J].
中国产业结构演变与经济增长
[J].
产业转型升级水平测度及其对劳动生产率的影响——以长江中游城市群26个城市为例
[J].
产业转型升级水平测度及劳动生产效率影响因素估测——以长三角地区16个城市为例
[J].
产业链视角的云南有色金属产业可持续发展研究
[J].
内蒙古矿业产业结构动态偏离份额分析
[J].
论东盟国家的产业升级
[J].
产业结构变迁对全要素能源效率的影响研究
[J].
人工智能助力有色金属工业转型升级
[J].
基于DEA模型的我国有色金属工业总体经济效益评价
[J].


 甘公网安备 62010202000672号