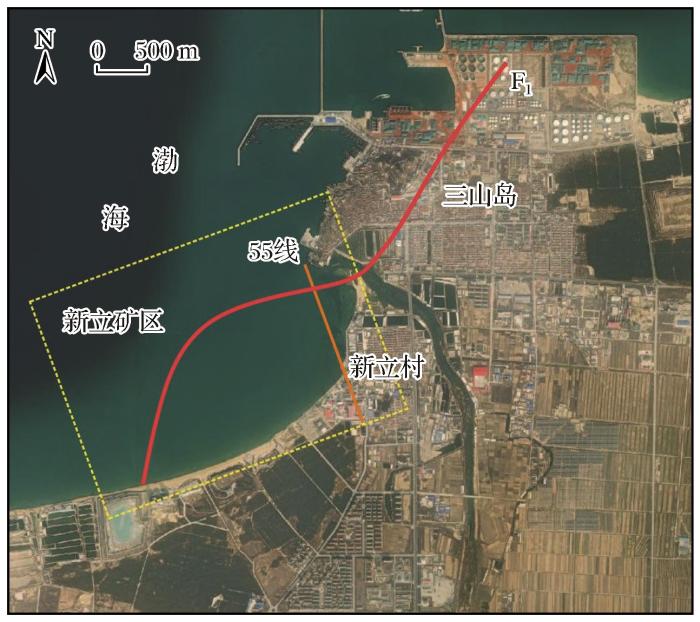
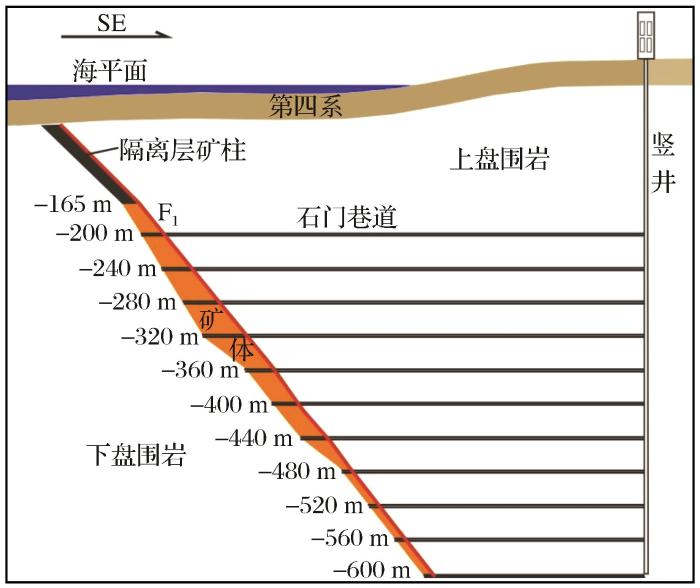
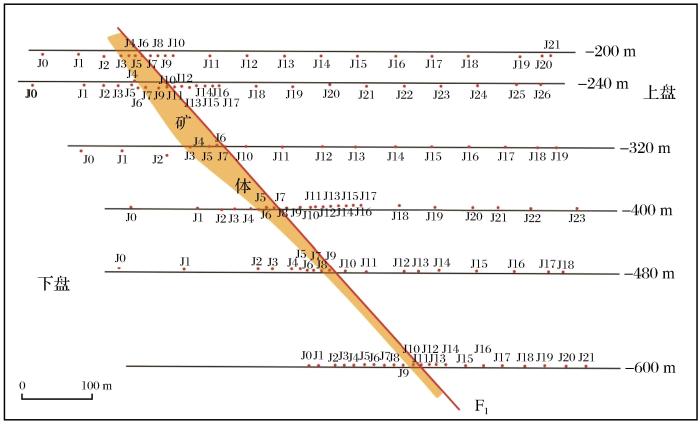
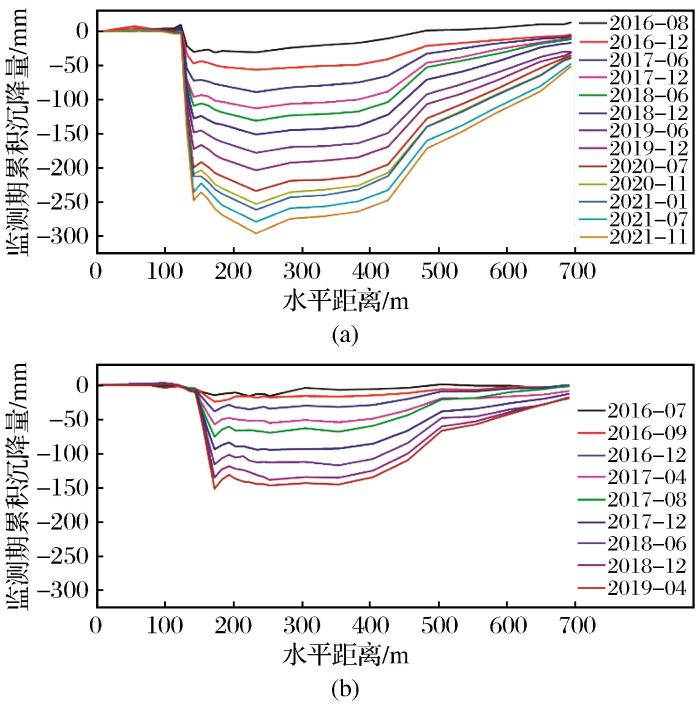
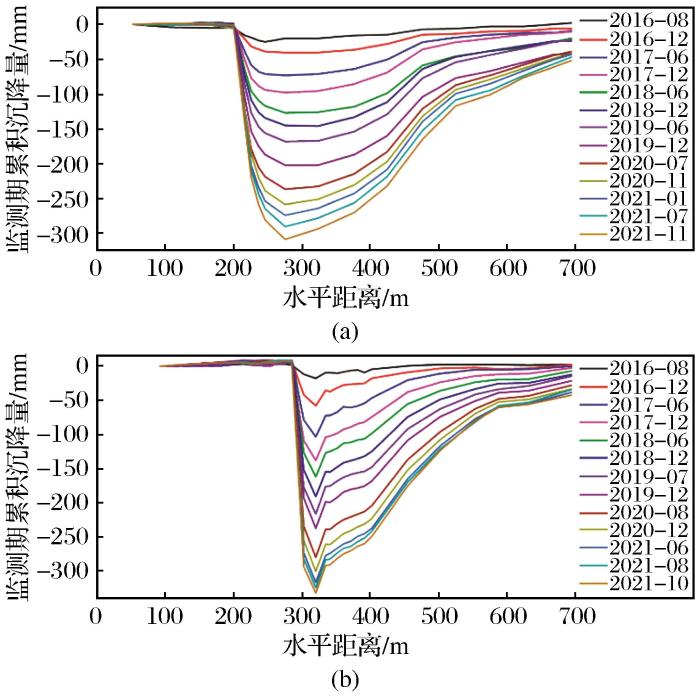
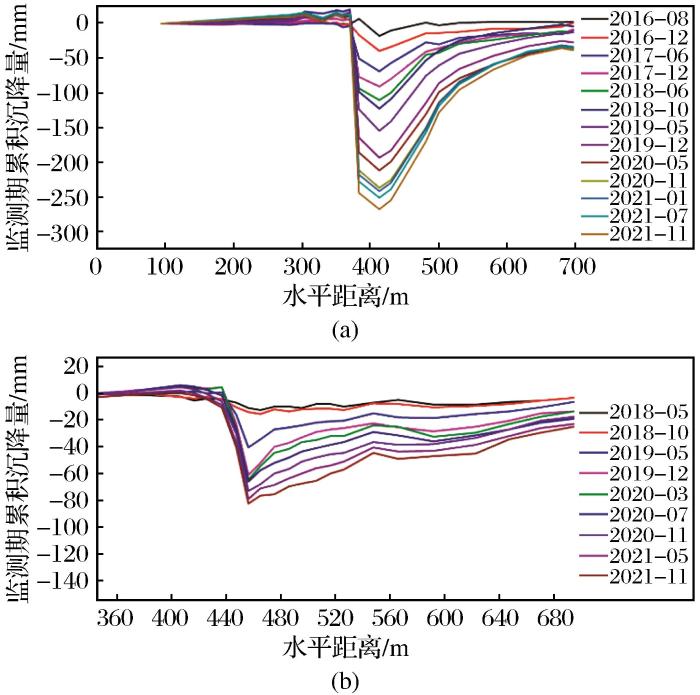
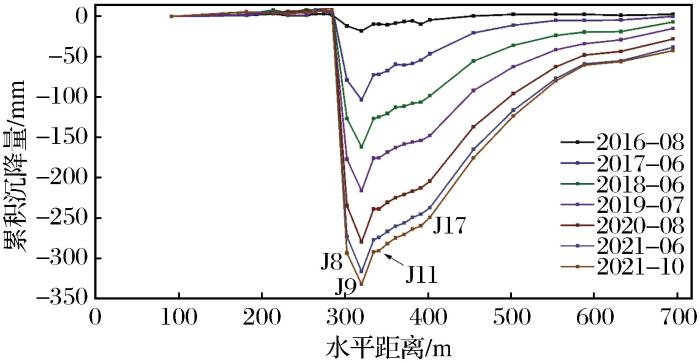
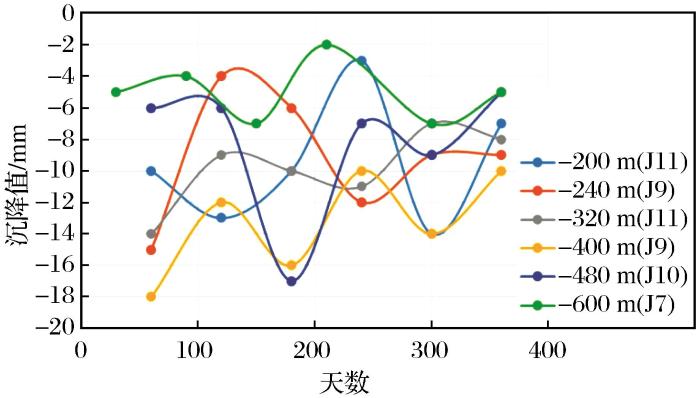
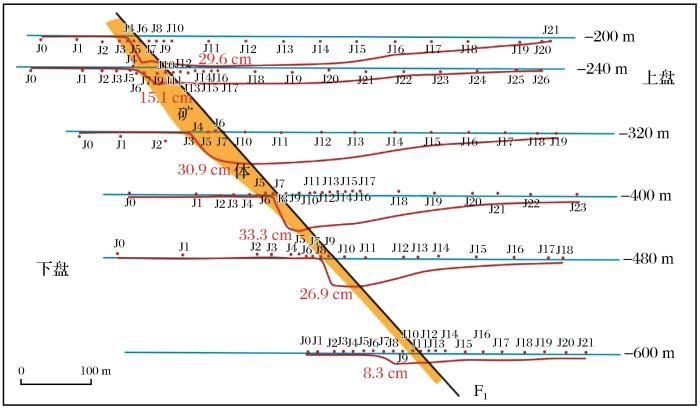
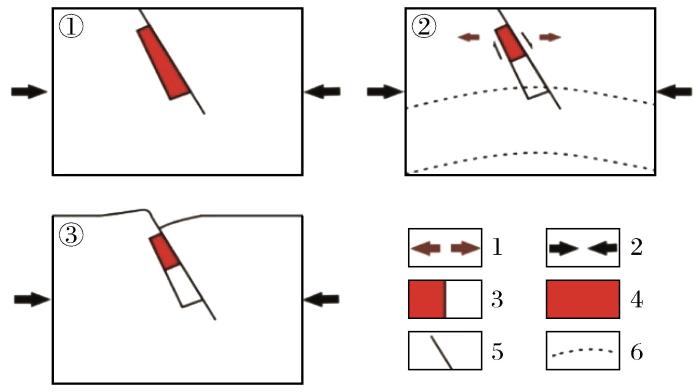
In recent years,with the decrease of land mineral resources,the development of marine minerals has become a global emerging industry,especially the mining of coastal bedrock deposits under the sea,has been the focus of mining development in various countries.For large-scale mining under the sea,the movement and deformation of the submarine rockbody poses a major threat to mining safety.It is important to pay attention to the deformation damage of the surrounding rock,which is important to realize the safe and efficient production of submarine mines. In order to study the deformation and damage characteristics of the surrounding rocks of the underground mine body in the Xinli mining area,the 55 exploration line perpendicular to the mine body was used as the monitoring profile,and the roadway roofs of -200 m,-240 m,-320 m,-400 m,-480 m,and -600 m sublevels were monitored by the underground four-level monitoring system that has been deployed since December 2015.The vertical displacements of the surrounding rocks in sublevels of the roadway at -200 m,-240 m,-320 m,-400 m,-480 m and -600 m were monitored for a long time,and the time series data of the settlement of the roadway roof in each sublevel were obtained.The deformation of the surrounding rock caused by metal ore mining is a complex mechanical problem.By analyzing the multi-year monitoring results,several significant characteristics of underground settlement are revealed.(1)The deformation caused by mining of the orebody in sublevel at different depths of the seabed shows a large influence range on the rock mass of the fault hanging wall,while the influence range on the footwall rock mass is small.(2)The closer to the orebody(or the ore-control fault F1) the greater the subsidence of the rock body,forming the feature that the slope of the curve to the left of the maximum settlement point in the settlement curve is larger in absolute value,while the slope of the curve to the right is slightly smaller in absolute value.(3)The final subsidence curves of the six sublevels in the line 55 profile have similar shapes and are generally asymmetric funnel-shaped,with the -200 m sublevel and the -240 m sublevel having a gentle bottom of the cumulative subsidence curve,which is similar to a “pot”,while the -320 m,-400 m,-480 m and -600 m sublevels have a “funnel” shaped subsidence curve.This phenomenon is related to the mining activities in the mine area.(4)The single settlement value in any monitoring period in the sublevel at any depth has the characteristics of up and down fluctuation,which reflects the non-linear characteristics of settlement deformation to a certain extent.The practice of seabed mining in Sanshandao gold mine confirms that:Since 2005,with the expansion of mining scale,the increase of mining intensity and the extension of mining years,the deformation of some of the underground tunnels is serious,and the movement and deformation of the underground surrounding rocks may cause seawater to gush into the tunnels along the damaged rocks,thus threatening the life safety of mining personnel.The study concluded that the thickness of the orebody,mining depth,mining intensity,surrounding lithology and rock structure as well as filling effect in the Xinli mining area are potential factors affecting the deformation of the surrounding rock in the mining of the inclined orebody.Among them,the presence of the controlling fault F1 in the mine area directly affects the shape of the surrounding rock deformation curve,and this deformation feature should be considered in future production work as well as safety maintenance work(roadway repair work) to prevent from affecting productivity or even generating safety accidents.
ZHANG Guodong, LIU Jia, MA Fengshan, LI Guang, GUO Jie. Analysis on the Characteristics and Influencing Factors of Underground Settlement in Submarine Mining of Sanshandao Gold Mine[J]. Gold Science and Technology, 2023, 31(5): 785-793 doi:10.11872/j.issn.1005-2518.2023.05.011
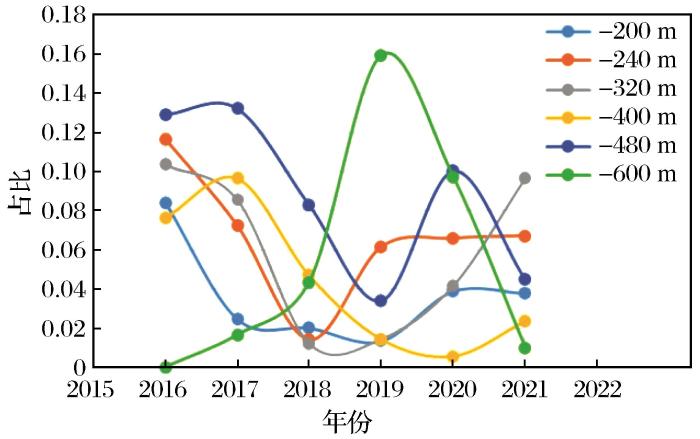
Fig.8
Settlement value curves of maximum settlement points in several sublevels of No.55 exploration line profile of Xinli mining area in 2017 (the monitoring value of -600 m sublevel are in 2019)
Analysis of main controlling factors of coal mining subsidence in Lu’an mining area
[J].Mining Safety and Environmental Protection,47(5):103-107.
LiuYucheng, DaiHuayang,2019.
Hyperbolic function model for predicting the main section surface deformation curve due to approximate horizontal coal seam underground longwall mining
[J].Journal of China University of Mining and Technology,48(3):676-681.
MeiSonghua, ShengQian, LiWenxiu,2004.
Advances in research on surface and rock mass movement
[J].Chinese Journal of Rock Mechanics and Engineering,(Supp.l):4535-4539.
ShiJibiao,2021.
Efficient statistical method for settlement prediction parameters of probability integral method
[J].Energy Technology and Management,46(6):197-200.
UnluT, AkcinH, YilmazO,2013.
An integrated approach for the prediction of subsidence for coal mining basins
... 地下开采引起的岩体移动和地表变形受多种因素的影响,如矿体形态、地应力、地质构造、水文地质条件、采矿量和采矿方法等(Brady et al.,1985;Kalenchuk et al.,2008).国内外众多学者以地表岩移监测为基础,从几何角度对开采沉降进行统计分析,运用的方法有负指数法(曾卓乔,1980)、剖面函数法(刘玉成等,2019)、典型曲线法(梅松华等,2004)、概率积分法(史继彪,2021)、克诺特影响函数法(Knothe,1952)和随机介质理论(贺跃光等,2003)等.总结来看,这些方法可以划分为经验法、分析法、数值法和混合方法(Laubscher et al.,1994;Yang,et al.,2013;Unlu et al.,2013). ...
Abnormal Subsidence Mechanism of Caving Mining Face with Thick Unconsolidated Layers and Collapse Columns
0
2019
Study on subsidence prediction of inclined orebody cut and fill mining in seabed
0
2019
Study on Theory and Technology of Paste Filling in Underground Goaf of Mine
0
2007
Stochastic medium model and monito of surface movements due to excavation
0
2003
Study on strata displacement under fault effect in underground engineering
0
2002
Block geometry and rockmass characterization for prediction of dilution potential into sub-level cave mine voids
1
2008
... 地下开采引起的岩体移动和地表变形受多种因素的影响,如矿体形态、地应力、地质构造、水文地质条件、采矿量和采矿方法等(Brady et al.,1985;Kalenchuk et al.,2008).国内外众多学者以地表岩移监测为基础,从几何角度对开采沉降进行统计分析,运用的方法有负指数法(曾卓乔,1980)、剖面函数法(刘玉成等,2019)、典型曲线法(梅松华等,2004)、概率积分法(史继彪,2021)、克诺特影响函数法(Knothe,1952)和随机介质理论(贺跃光等,2003)等.总结来看,这些方法可以划分为经验法、分析法、数值法和混合方法(Laubscher et al.,1994;Yang,et al.,2013;Unlu et al.,2013). ...
Analysis of mining subsidence law under the compound influence of various geological and mining factors
0
2021
Time influence on a formation of a subsidence surface
1
1952
... 地下开采引起的岩体移动和地表变形受多种因素的影响,如矿体形态、地应力、地质构造、水文地质条件、采矿量和采矿方法等(Brady et al.,1985;Kalenchuk et al.,2008).国内外众多学者以地表岩移监测为基础,从几何角度对开采沉降进行统计分析,运用的方法有负指数法(曾卓乔,1980)、剖面函数法(刘玉成等,2019)、典型曲线法(梅松华等,2004)、概率积分法(史继彪,2021)、克诺特影响函数法(Knothe,1952)和随机介质理论(贺跃光等,2003)等.总结来看,这些方法可以划分为经验法、分析法、数值法和混合方法(Laubscher et al.,1994;Yang,et al.,2013;Unlu et al.,2013). ...
Cave mining-the state of the art
1
1994
... 地下开采引起的岩体移动和地表变形受多种因素的影响,如矿体形态、地应力、地质构造、水文地质条件、采矿量和采矿方法等(Brady et al.,1985;Kalenchuk et al.,2008).国内外众多学者以地表岩移监测为基础,从几何角度对开采沉降进行统计分析,运用的方法有负指数法(曾卓乔,1980)、剖面函数法(刘玉成等,2019)、典型曲线法(梅松华等,2004)、概率积分法(史继彪,2021)、克诺特影响函数法(Knothe,1952)和随机介质理论(贺跃光等,2003)等.总结来看,这些方法可以划分为经验法、分析法、数值法和混合方法(Laubscher et al.,1994;Yang,et al.,2013;Unlu et al.,2013). ...
Extraction technology of ocean mining
0
2003
Analysis of main controlling factors of coal mining subsidence in Lu’an mining area
0
2020
Hyperbolic function model for predicting the main section surface deformation curve due to approximate horizontal coal seam underground longwall mining
0
2019
Advances in research on surface and rock mass movement
0
2004
Efficient statistical method for settlement prediction parameters of probability integral method
0
2021
An integrated approach for the prediction of subsidence for coal mining basins
1
2013
... 地下开采引起的岩体移动和地表变形受多种因素的影响,如矿体形态、地应力、地质构造、水文地质条件、采矿量和采矿方法等(Brady et al.,1985;Kalenchuk et al.,2008).国内外众多学者以地表岩移监测为基础,从几何角度对开采沉降进行统计分析,运用的方法有负指数法(曾卓乔,1980)、剖面函数法(刘玉成等,2019)、典型曲线法(梅松华等,2004)、概率积分法(史继彪,2021)、克诺特影响函数法(Knothe,1952)和随机介质理论(贺跃光等,2003)等.总结来看,这些方法可以划分为经验法、分析法、数值法和混合方法(Laubscher et al.,1994;Yang,et al.,2013;Unlu et al.,2013). ...
Rheologic behavior of high-density backfill and reasonable determination of the parameters for its gravity-flow transport
0
2004
Prediction of mining subsidence under thin bedrocks and thick unconsolidated layers based on filed measurement and artificial neural networks
1
2013
... 地下开采引起的岩体移动和地表变形受多种因素的影响,如矿体形态、地应力、地质构造、水文地质条件、采矿量和采矿方法等(Brady et al.,1985;Kalenchuk et al.,2008).国内外众多学者以地表岩移监测为基础,从几何角度对开采沉降进行统计分析,运用的方法有负指数法(曾卓乔,1980)、剖面函数法(刘玉成等,2019)、典型曲线法(梅松华等,2004)、概率积分法(史继彪,2021)、克诺特影响函数法(Knothe,1952)和随机介质理论(贺跃光等,2003)等.总结来看,这些方法可以划分为经验法、分析法、数值法和混合方法(Laubscher et al.,1994;Yang,et al.,2013;Unlu et al.,2013). ...
Physical significance and correct application of parameters of negative exponential function method for calculating surface movement
0
1980
Stability analysis of rock mass under disturbance of submarine mine
0
2020
Research progress of mining overlying stratus failure law and control technology
... 地下开采引起的岩体移动和地表变形受多种因素的影响,如矿体形态、地应力、地质构造、水文地质条件、采矿量和采矿方法等(Brady et al.,1985;Kalenchuk et al.,2008).国内外众多学者以地表岩移监测为基础,从几何角度对开采沉降进行统计分析,运用的方法有负指数法(曾卓乔,1980)、剖面函数法(刘玉成等,2019)、典型曲线法(梅松华等,2004)、概率积分法(史继彪,2021)、克诺特影响函数法(Knothe,1952)和随机介质理论(贺跃光等,2003)等.总结来看,这些方法可以划分为经验法、分析法、数值法和混合方法(Laubscher et al.,1994;Yang,et al.,2013;Unlu et al.,2013). ...
... 地下开采引起的岩体移动和地表变形受多种因素的影响,如矿体形态、地应力、地质构造、水文地质条件、采矿量和采矿方法等(Brady et al.,1985;Kalenchuk et al.,2008).国内外众多学者以地表岩移监测为基础,从几何角度对开采沉降进行统计分析,运用的方法有负指数法(曾卓乔,1980)、剖面函数法(刘玉成等,2019)、典型曲线法(梅松华等,2004)、概率积分法(史继彪,2021)、克诺特影响函数法(Knothe,1952)和随机介质理论(贺跃光等,2003)等.总结来看,这些方法可以划分为经验法、分析法、数值法和混合方法(Laubscher et al.,1994;Yang,et al.,2013;Unlu et al.,2013). ...
... 地下开采引起的岩体移动和地表变形受多种因素的影响,如矿体形态、地应力、地质构造、水文地质条件、采矿量和采矿方法等(Brady et al.,1985;Kalenchuk et al.,2008).国内外众多学者以地表岩移监测为基础,从几何角度对开采沉降进行统计分析,运用的方法有负指数法(曾卓乔,1980)、剖面函数法(刘玉成等,2019)、典型曲线法(梅松华等,2004)、概率积分法(史继彪,2021)、克诺特影响函数法(Knothe,1952)和随机介质理论(贺跃光等,2003)等.总结来看,这些方法可以划分为经验法、分析法、数值法和混合方法(Laubscher et al.,1994;Yang,et al.,2013;Unlu et al.,2013). ...
概率积分法沉降预测参数高效统计方法
1
2021
... 地下开采引起的岩体移动和地表变形受多种因素的影响,如矿体形态、地应力、地质构造、水文地质条件、采矿量和采矿方法等(Brady et al.,1985;Kalenchuk et al.,2008).国内外众多学者以地表岩移监测为基础,从几何角度对开采沉降进行统计分析,运用的方法有负指数法(曾卓乔,1980)、剖面函数法(刘玉成等,2019)、典型曲线法(梅松华等,2004)、概率积分法(史继彪,2021)、克诺特影响函数法(Knothe,1952)和随机介质理论(贺跃光等,2003)等.总结来看,这些方法可以划分为经验法、分析法、数值法和混合方法(Laubscher et al.,1994;Yang,et al.,2013;Unlu et al.,2013). ...
... 地下开采引起的岩体移动和地表变形受多种因素的影响,如矿体形态、地应力、地质构造、水文地质条件、采矿量和采矿方法等(Brady et al.,1985;Kalenchuk et al.,2008).国内外众多学者以地表岩移监测为基础,从几何角度对开采沉降进行统计分析,运用的方法有负指数法(曾卓乔,1980)、剖面函数法(刘玉成等,2019)、典型曲线法(梅松华等,2004)、概率积分法(史继彪,2021)、克诺特影响函数法(Knothe,1952)和随机介质理论(贺跃光等,2003)等.总结来看,这些方法可以划分为经验法、分析法、数值法和混合方法(Laubscher et al.,1994;Yang,et al.,2013;Unlu et al.,2013). ...


 甘公网安备 62010202000672号