×
模态框(Modal)标题
在这里添加一些文本
Close
Close
Submit
Cancel
Confirm
×
模态框(Modal)标题
×
ISSN 1005-2518
CN 62-1112/TF
RSS
|
Email Alert
Toggle navigation
Home
About Us
About Journal
Research Institute
Included in
Editorial Board
Journal Online
Online First
Current Issue
Archive
Most Read
Most Download
Advanced Search
Author Center
Policy System
Publishing Ethics
Editorial Policy
Open Access Policy
Contact Us
中文
Figure/Table detail
Research on the Dynamic Mechanical Response Characteristics of Surroun-ding Rock During Mining in a Mine Based on the Discrete Element Method
Jiadong QIU, Rui HUANG, Lixia SONG, Zhonghua ZHU
Gold Science and Technology
, 2025, 33(
5
): 996-1008. DOI:
10.11872/j.issn.1005-2518.2025.05.378
摩擦系数
线性接触
黏结
材料
阻尼
模量
Ec
/GPa
刚度比/(
k
n
/
k
s
)
模量
E
¯
c
/GPa
刚度比/(
k
¯
n
/
k
¯
s
)
法向强度/MPa
黏结力/MPa
围岩
0.932
0.0157
1.9
0.49
1.9
0.49
22
22
矿体
0.710
0.0157
1.0
0.50
1.0
0.50
15
15
注浆后破碎体
0.710
0.0157
35.0
4.00
35.0
4.00
11
11
Table 2
Micro-mechanical parameters of numerical rock mass
Other figure/table from this article
Fig. 1
Simplified schematic diagram of deep stope
Table 1
Macroscopic mechanical parameters of rock mass materials
Fig. 2
Schematic diagram of basic composition of rock mass
Fig. 3
3D numerical model diagrams of deep stope
Fig. 4
Internal blasting principle of PFC
3D
Fig. 5
Stress waves generated by micro-unit explosive blasting(diameter of the blaste hole is 65 mm)
Fig. 6
Propagation diagram of blast stress wave
Fig. 7
Propagation cloud maps of blasting stress wave for first row
Fig. 8
Propagation cloud maps of blast stress wave from second row to fifth row
Fig. 9
Layout diagrams of monitoring points
Fig. 10
Typical vibration curves
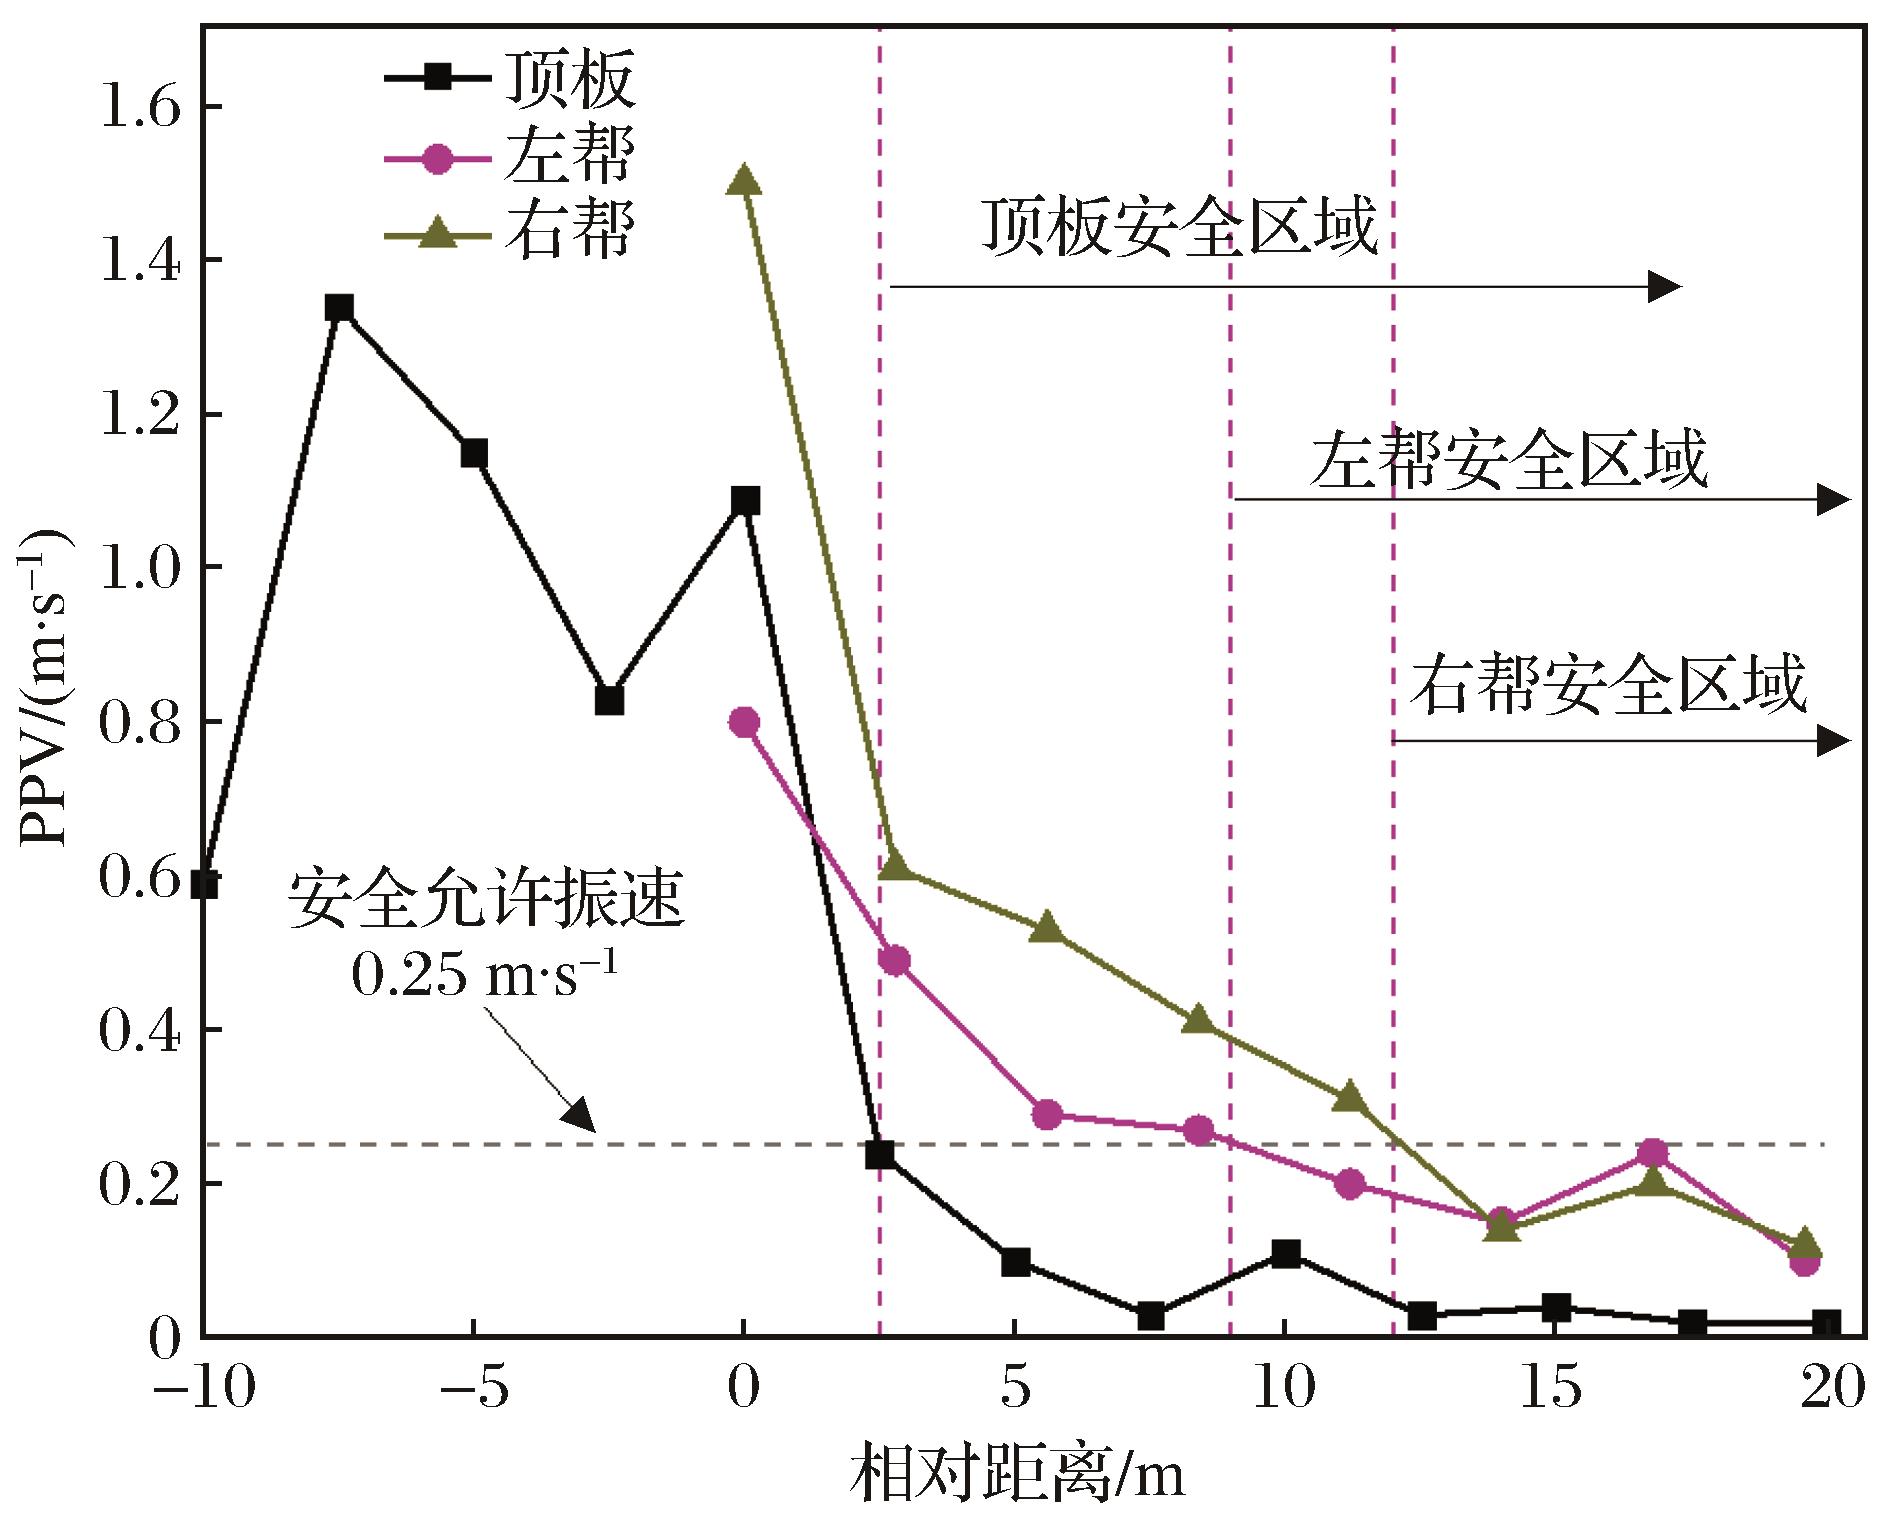
Fig. 11
Schematic distribution of peak vibration velocity(PPV) at different relative positions
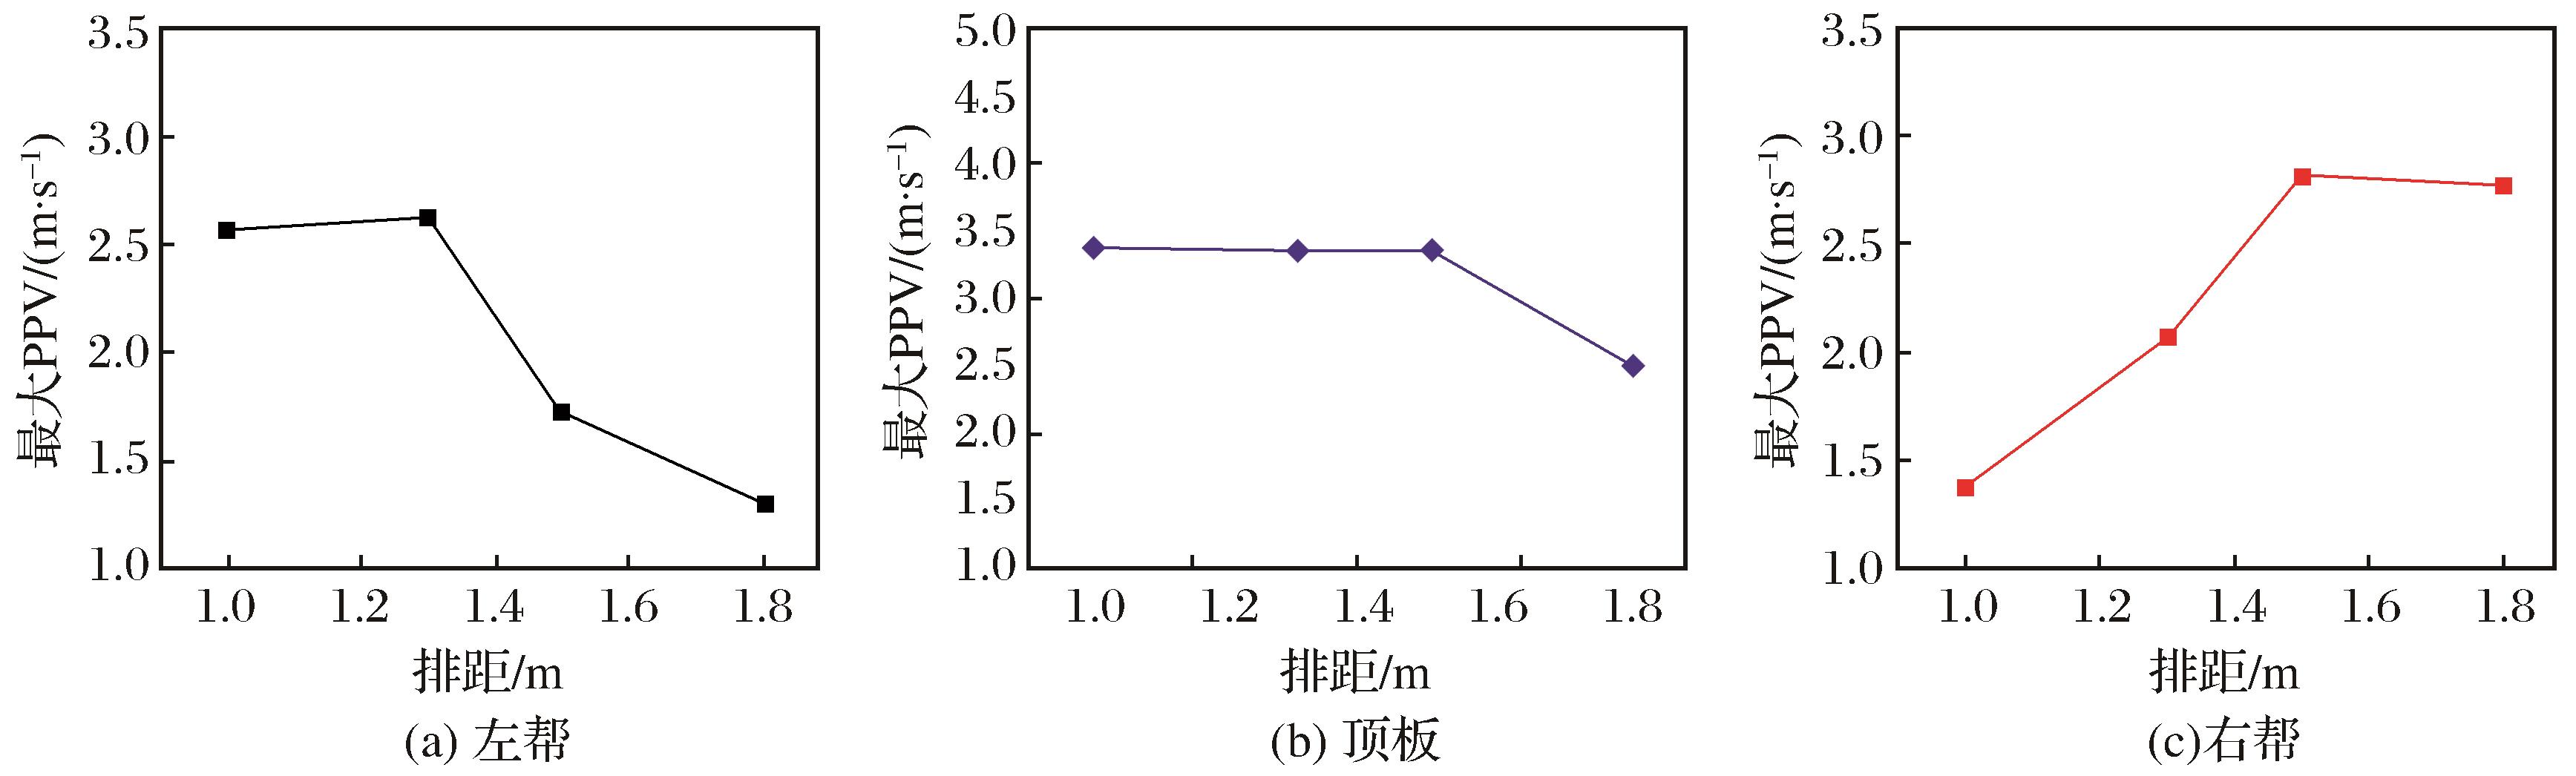
Fig. 12
Comparison of maximum PPV of different row spacing
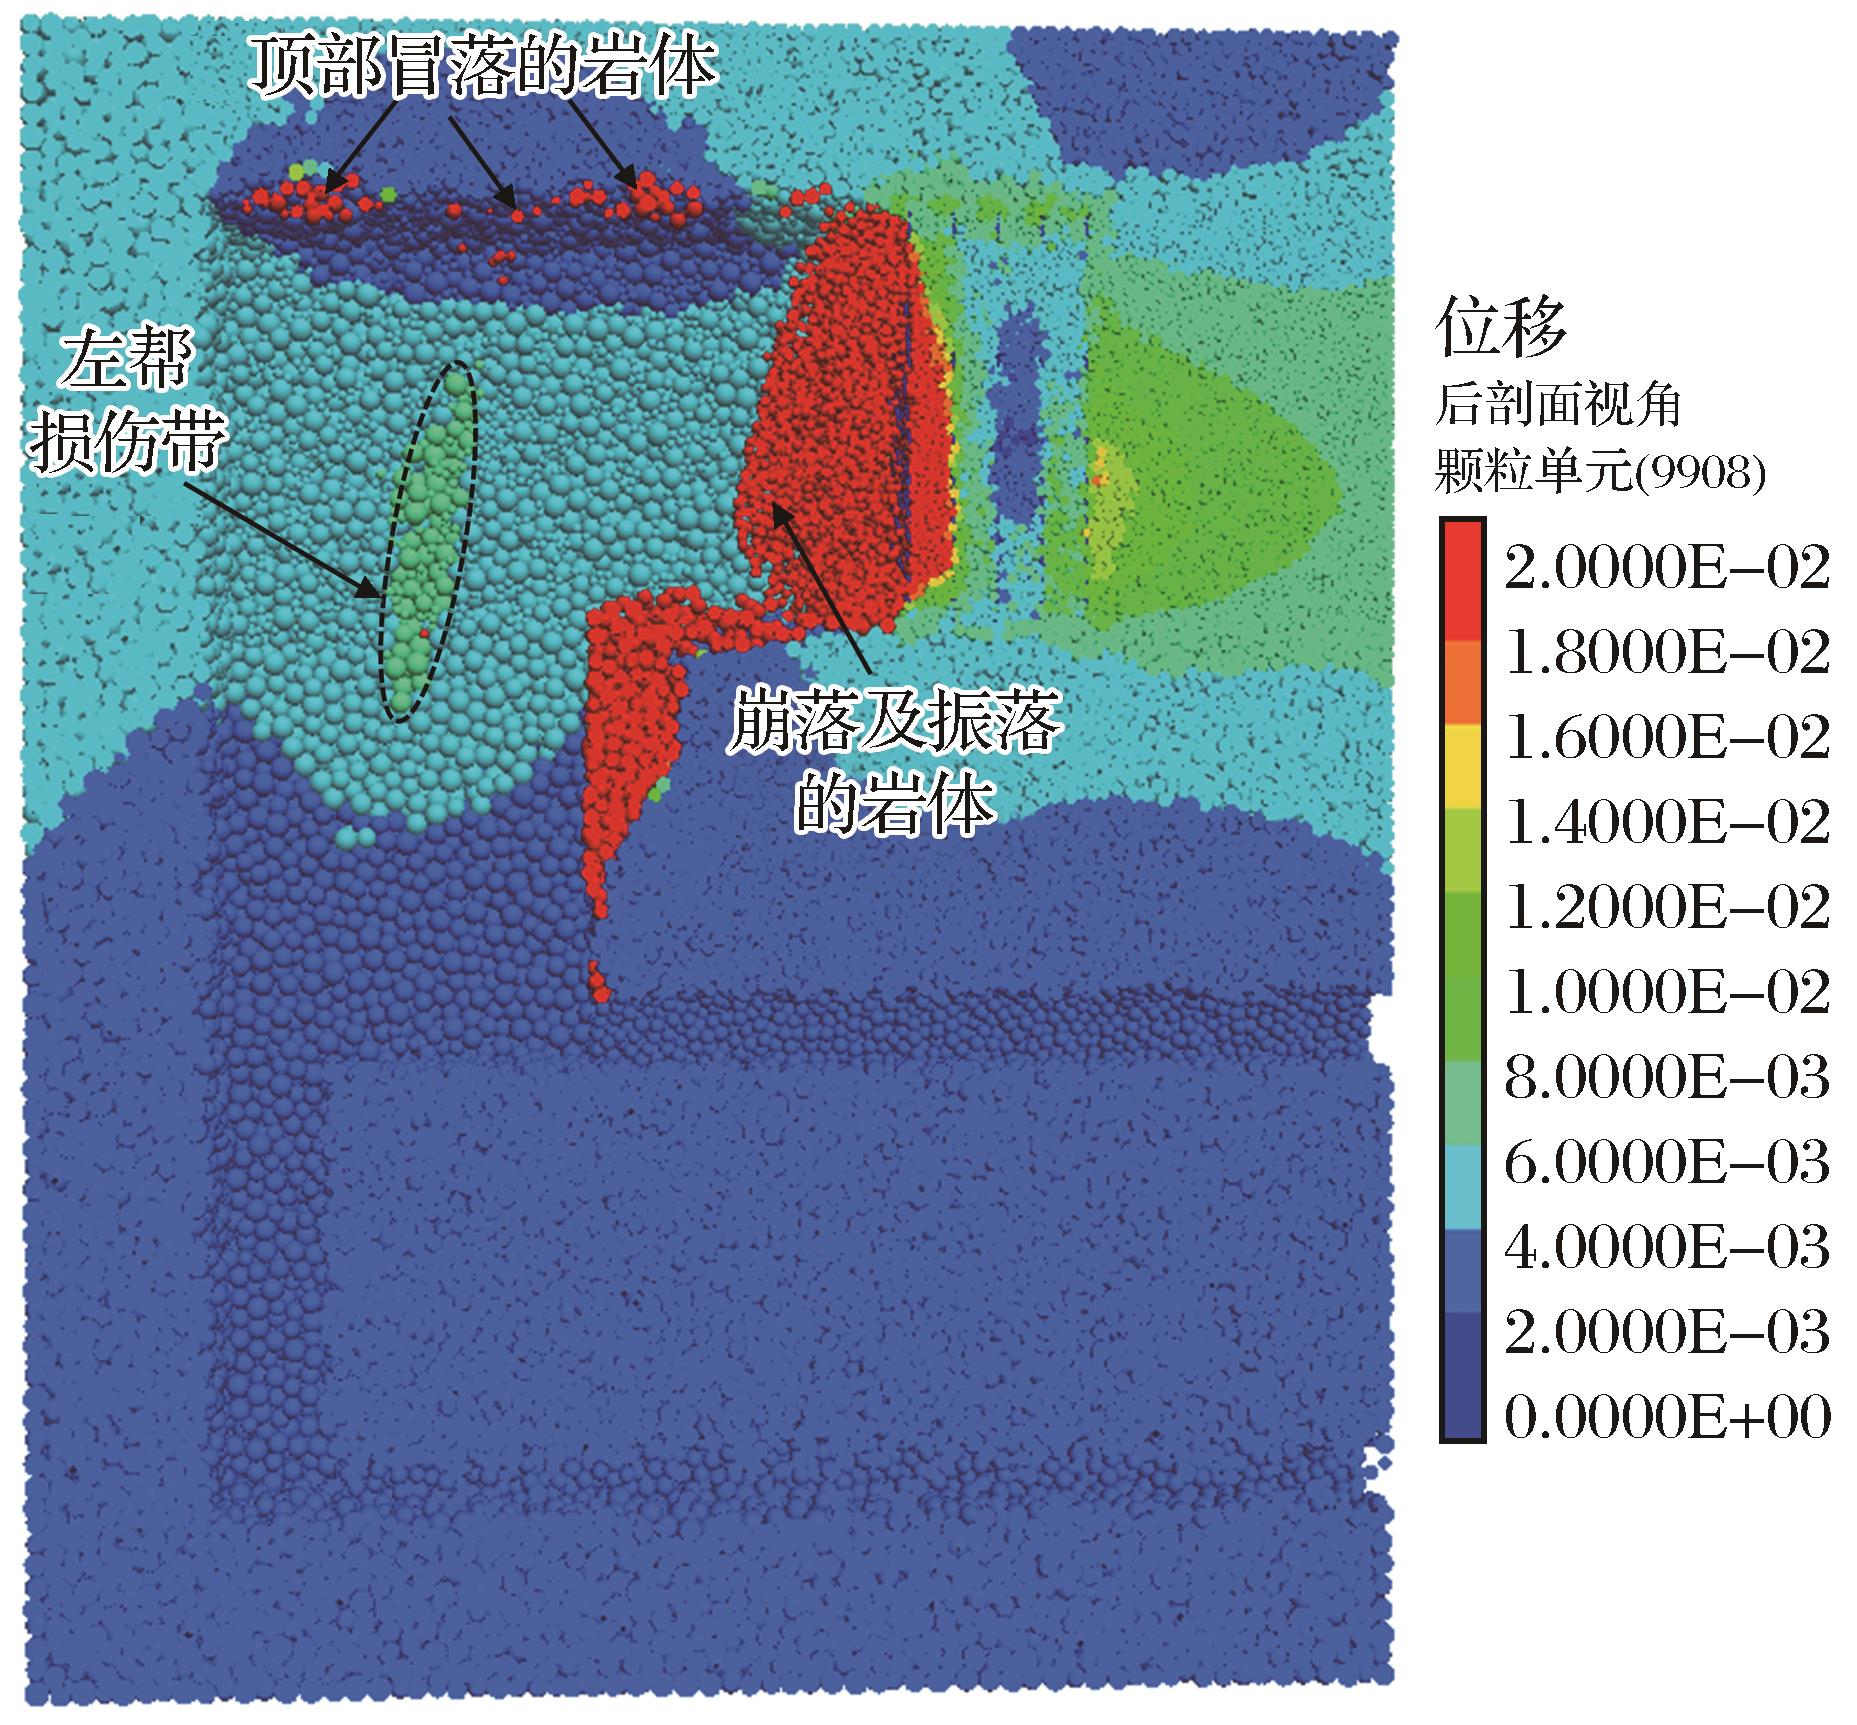
Fig. 13
Displacement cloud diagram of typical model
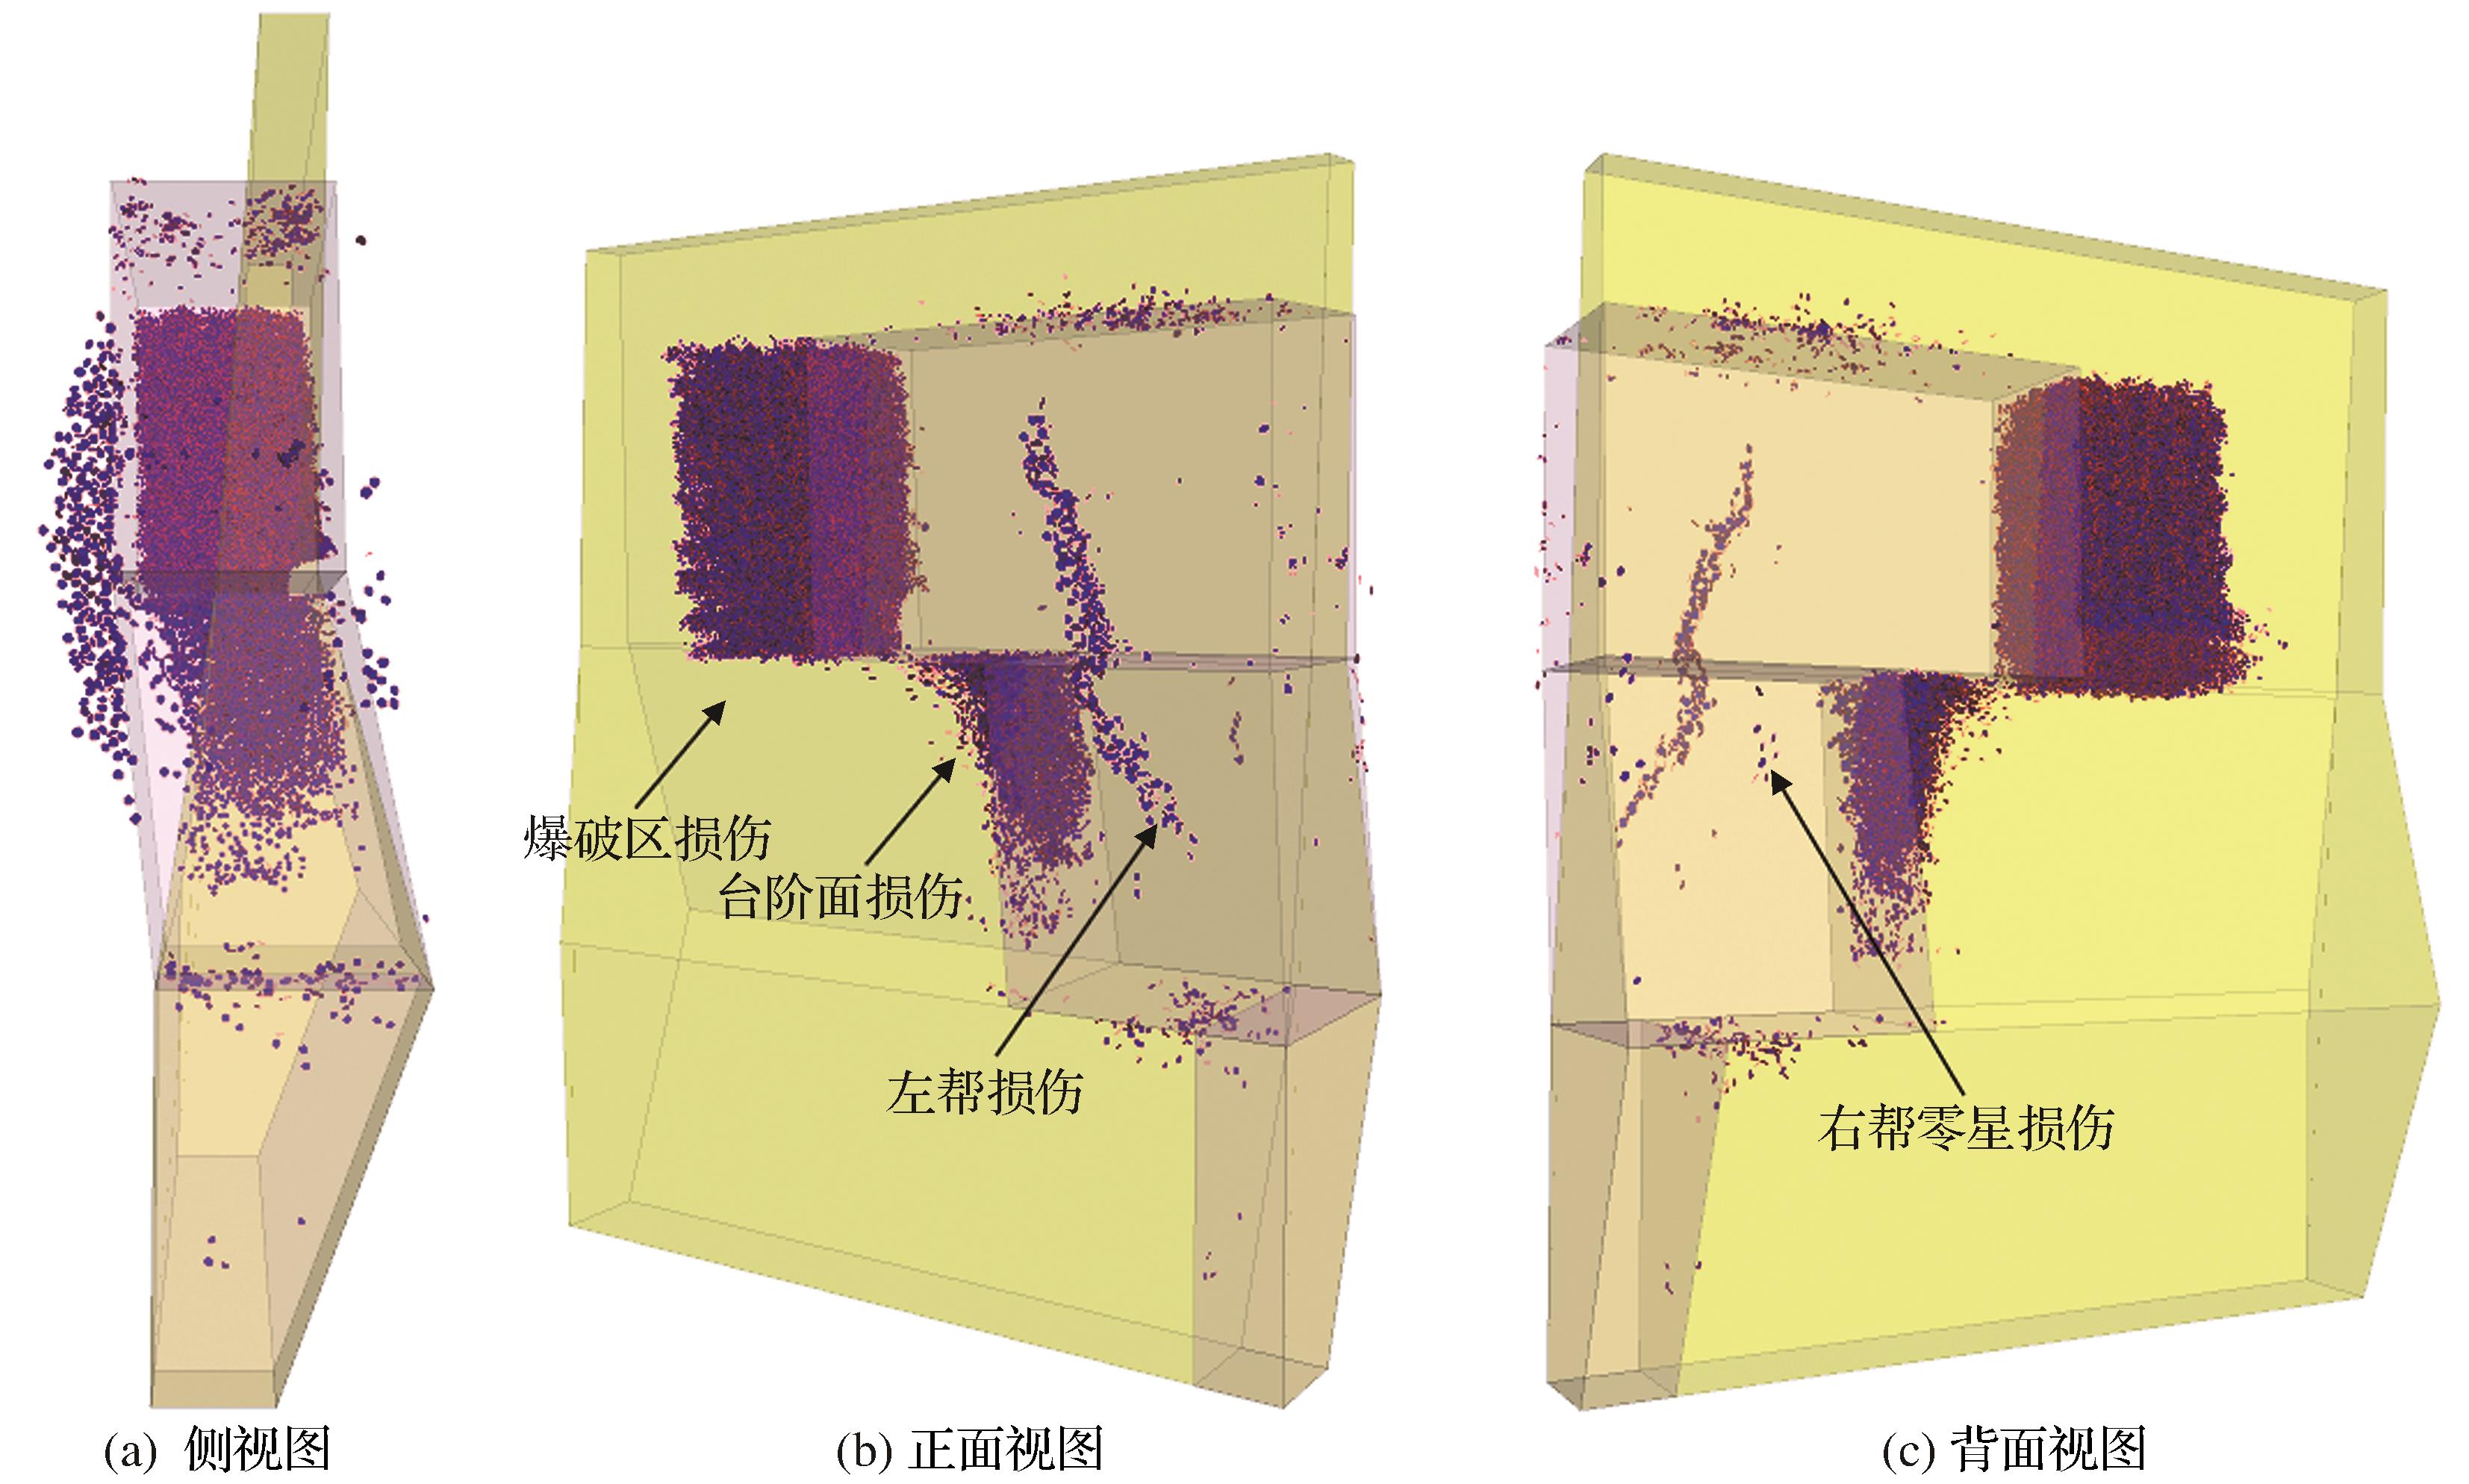
Fig. 14
Damage of surrounding rock after blasting
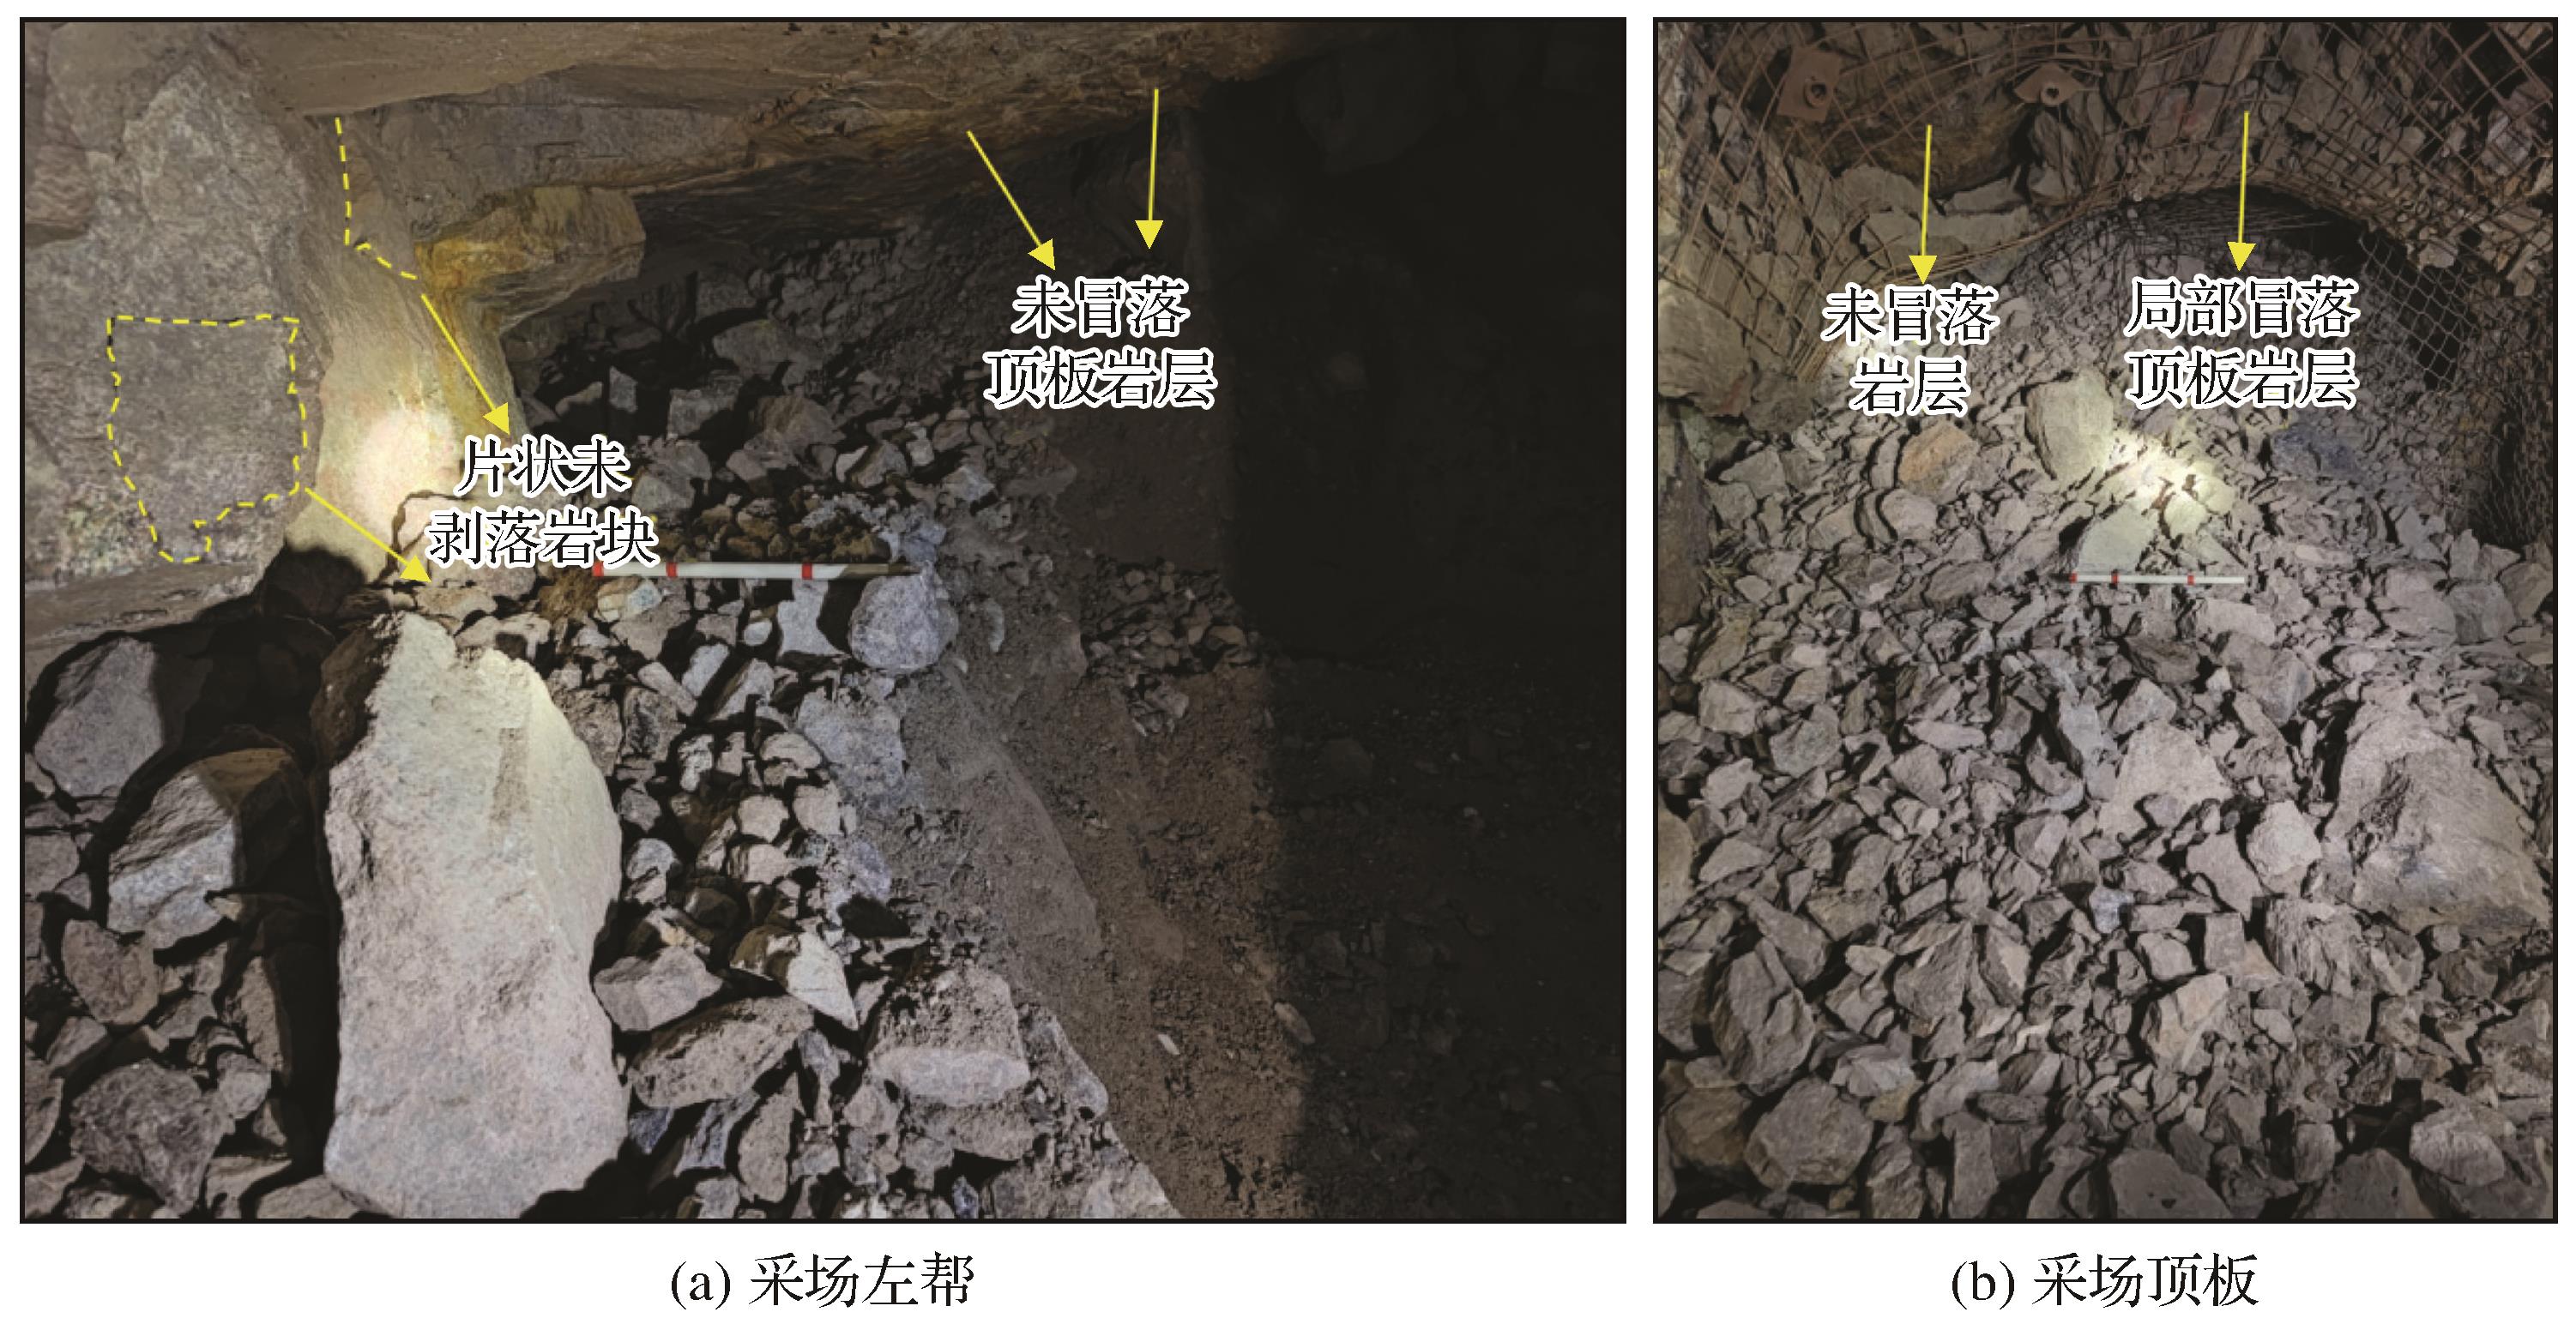
Fig. 15
Damage and failure of surrounding rock in goaf


 甘公网安备 62010202000672号