ISSN 1005-2518
CN 62-1112/TF
Mining Technology and Mine Management

Prediction of Blasting Vibration Waveform in Open-pit Mine Based on the Characteristic Value of Blasting Center Distance

  • Honglu FEI , 1, 2 ,
  • Jiwei GUO 1 ,
  • Liangyu CHEN 1 ,
  • Shijie BAO 1 ,
  • Gang HU 1 ,
  • Guangyan DUAN 1
Expand
  • 1. Institute of Blasting Technology,Liaoning Technical University,Fuxin 123000,Liaoning,China
  • 2. Collaborative Innovation Center of Mine Major Disaster Prevention and Environmental Restoration,Fuxin 123000,Liaoning,China

Received date: 2024-12-23

  Revised date: 2025-06-11

  Online published: 2026-01-16

Copyright

© Editorial Department of Gold Science and Technology (CC BY-NC-ND)

Abstract

Blasting vibrations in open-pit mines can potentially lead to damage in surrounding rock formations,slope instability,ground fissures,and structural damage to buildings. Additionally,these vibrations may disrupt the daily activities and safety of nearby residents and facilities. Accurate prediction of blasting vibrations is essential for scientifically assessing their impact on the surrounding environment and infrastructure,optimizing blasting design parameters,ensuring construction safety,and providing informed decision-making support. Currently,in China,the assessment and verification of blasting vibration safety primarily focus on peak particle velocity and particle frequency. However,relying solely on these parameters as safety criteria is insufficiently reliable. A comprehensive evaluation of the entire blasting vibration process is necessary to objectively assess its characteristics and effects. Consequently,the prediction of blasting vibration waveforms has emerged as a significant area of research. The waveform of blasting vibrations in open-pit mines is influenced by various factors,including geological terrain,blasting parameters,and charge structure.Accurately predicting the waveform of blasting vibrations holds significant practical importance for the analysis of blasting vibration velocity,frequency,duration,and the design and evaluation of safety measures. To facilitate the prediction of blasting vibration waveforms in open-pit mines,this study proposes a novel method that integrates the characteristic value U, representing the distance from the blast source(R), with principal component analysis (PCA) and a backpropagation(BP) neural network. Initially,this method involves extracting the extreme values from the blasting vibration waveform data and defining an idealized feature value U for R, establishing a corresponding relationship between R and the vibration signal waveform. PCA is employed to conduct a principal component analysis on variables such as step height,R,and explosive consumption,ultimately reducing these variables to two principal components. These components, combined with U, serve as input parameters for the BP neural network,while the corresponding vibration velocities at each time point in the waveform are utilized as output parameters. Extreme value prediction was conducted on the blasting vibration waveform,and the predicted waveform was derived through interpolation calculations. The findings of the study demonstrate that,when comparing the predicted results with the empirical data,the PCA-BP model exhibits a closer approximation to zero than the BP model in terms of root mean square error (RMSE) and mean absolute error (MAE). Furthermore,the relative error in the peak vibration velocity predicted by the PCA-BP model is less than 11%,and the absolute error in the main frequency is less than 10 Hz. The predictive accuracy of the PCA-BP model surpasses that of the BP model,thereby confirming the model’s accuracy and reliability. This method offers an enhanced capability for predicting blasting vibration waveforms in open-pit mines under consistent topographical,geomorphological,and geological conditions,thereby providing a significant reference for blasting design and safety assessment.

Cite this article

Honglu FEI , Jiwei GUO , Liangyu CHEN , Shijie BAO , Gang HU , Guangyan DUAN . Prediction of Blasting Vibration Waveform in Open-pit Mine Based on the Characteristic Value of Blasting Center Distance[J]. Gold Science and Technology, 2025 , 33(6) : 1117 -1127 . DOI: 10.11872/j.issn.1005-2518.2025.06.018

在爆破作业中,爆破振动产生的动力效应会引发围岩破坏损伤、边坡失稳、地面裂缝和建(构)筑物受损等一系列工程灾害(陈士海等,2022李启月等,2024)。因此,科学预测爆破振动,能够有效评估爆破作业对周边环境和建(构)筑物的影响,优化爆破设计参数,确保爆破施工的安全性。
随着机器学习和人工智能技术的快速发展,国内外学者基于机器学习提出了多种峰值振速的预测模型,包括LS-SVM模型(郑皓文等,2018)、BP神经网络(施建俊等,2017王帅,2022)、GRA-GEP(陈秋松等,2016)、KS-GS-SVR(费鸿禄等,2023)、GRA-EPSO-SVM(张鹏飞,2025)和模糊逻辑模型等(Bakhshandeh et al,2010Ghasemi et al,2013)。这些预测模型能够较好地消除多因素、非线性特征对预测结果的影响,且预测评价指标(MSER 2SE等)均优于传统萨氏公式。在爆破振动频率方面,选取不同的输入特征参数,基于人工神经网络(Khandelwal et al,2009;Álvarez-Vigil et al,2012)、GEP(Dindarloo et al,2015)、自适应神经模糊推理系统(Singh et al,2008)、随机森林(Dong et al,2011)和支持向量机(王勇等,2017)等对爆破振动主频进行预测,预测精度均高于经验公式。然而,仅以爆破峰值振速和频率作为爆破振动的安全判据,存在可靠性不足的问题。因此,爆破振动波形预测成为近年来的研究热点,其中最常用的方法是波形叠加预测(徐全军等,1998廖晓目,2023)。Anderson et al(1985)根据起爆顺序、段药量和延时时间,构成脉冲函数,首次采用线性叠加理论对多孔爆破振动进行预测;此后,雷振(2015)将Anderson模型与非线性系统模型相结合,进一步提高了波形预测的准确性。刘小鸣等(2020)将非线性叠加模型用于预测多孔微差爆破振动波形,利用等效球形药包,得出某一等效药包质点振动波形函数,并基于单孔和Blair非线性叠加法(Blair,2008),得出某个柱状药包的振速波形函数,推导出群孔延时爆破引起的振动波形函数。
此外,数值插值(楼矗云等,2017)、相似理论(徐芳妹等,2014)、信号分析(燕永峰等,2011)及随机过程建模(李洪超等,2025)等方法在爆破振动波形预测中也得到了广泛应用,通过数据推演、理论构建、频带重构和概率预测等方法提升了爆破振动波形预测精度。
目前,爆破振动的预测和控制主要关注峰值振速和主频方面,而对于爆破振动波形预测侧重于理论分析预测。由于难以通过某个特征对应某一点的振动信号,从而影响机器学习输入参数的选择,波形预测在机器学习方面还需深入讨论。鉴于此,本文对工程爆破振动数据进行极值提取,提出爆心距特征值(U),使得爆心距与振动信号的波形存在对应关系,为后续构建的预测模型提供对应的输入参数;同时,利用PCA降维变量和爆心距特征值(U)作为BP神经网络的输入参数,波形中各时间点所对应的振速作为输出参数,对爆破振动波形进行极值预测并经过插值计算得出预测波形,实现爆破振动波形的预测,为爆破设计和安全提供参考。

1 爆破振动数据处理

1.1 数据极值提取

首先采用实测数据取极值方式对数据进行处理,定义一阶差分 Δ x ( i ) = x ( i + 1 ) - x ( i ),其中 x ( i )表示输入数据数组中的第 i个元素。使用符号函数 s i g n ( y i )判断一个数 y i的正负符号,定义如下:
s i g n ( y ) = 1 , y > 0 s i g n ( y ) = 0 , y = 0 s i g n ( y ) = - 1 , y < 0
I n d M i n = i | i = 1,2 , , n - 1 , s i g n ( Δ s i g n ( Δ x ( i ) ) ) > 0 I n d M a x = i | i = 1,2 , , n - 1 , s i g n ( Δ s i g n ( Δ x ( i ) ) ) < 0

1.2 定义理想化爆心距特征值

在延时起爆条件下,每个炮孔和炮孔内等效药包对应的爆心距与起爆时刻之间存在非线性关系,如图1所示。其中,Ri 为炮孔至测点距离,ri 为等效药包至测点距离。通常地,当群孔延时起爆时,随着单个炮孔与监测点距离Ri 的减小,爆破振动波形振幅增大,反之振幅减小。
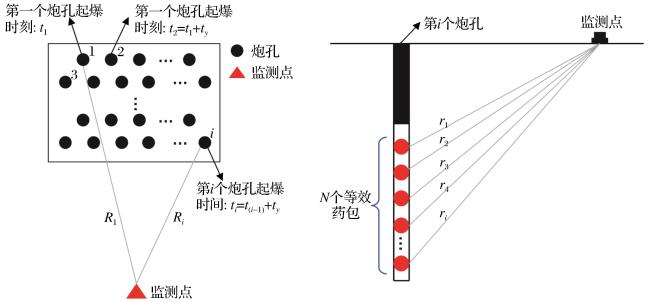
图1 单孔等效药包划分及群孔延时爆破示意图

Fig. 1 Schematic diagram of single hole equivalent charge division and group hole delayed blasting

在群孔延时爆破中,单个炮孔振动的时间Ti 由起爆时刻与延时时间确定[式(3)],单一炮孔内,根据式(4)采样频率f s划分单个炮孔N个等效药包。
T i = t i + t y
N = T ( i + 1 ) - T ( i ) × f s
式中:ti 为第i个炮孔起爆时刻;t y为延时时间;Ti 为第i个炮孔振动产生的时间;f s为采样频率;N为第i个炮孔内划分等效药包个数。
针对一段爆破振动,峰值振速、主频和持时是唯一值,然而由于采样频率不同,振动波形信号值较多,很难通过某个特征对应某一点的振动信号。为此,本文提出爆心距特征值(U),旨在建立爆破振动波形幅值与空间位置的非线性映射关系。其物理内涵包含:爆破振动幅值随着爆心距的增大呈非线性衰减;修正多孔延时起爆引起的波形相位反转。爆心距特征值(U)的推导公式如下:
(1)归一化爆心距
将实测爆心距映射至[0,1]区间,可表示为
R n = R i - R m i n R m a x - R m i n
式中:R maxR min分别为炮孔对应测点的最大爆心距和最小爆心距(m);Ri 为第i个炮孔所对应的爆心距(m)。
(2)构建非线性衰减函数
引入调节系数α,构造分母项强化近场敏感性,表示为
U n = 1 α + R n
式中:α=0.1,用于抑制近区幅值发散;当RiR min,分母趋近于αUn 值增大,强化近区振动贡献;当RiR max,分母趋近于α+1,Un 值减小,抑制远区噪声。
(3)添加相位修正项
引入(-1) k 修正延时起爆相位偏移,表示为
U = - 1 k α + R n
式中:k为等效药包个数(k=1,2,…,N),相邻药包振动波反相,避免波形叠加抵消。
根据式(7)定义相应炮孔起爆所对应的时间段和振动信号所对应的爆心距特征值(U),使得爆心距与振动信号的波形相对应。

2 主成分分析(PCA)

主成分分析(PCA)被广泛应用于多元数据降维和特征提取中(温廷新等,2015王佳信等,2017赵红梦等,2020)。PCA通过线性变换将高维数据转化为少数几个不相关的主成分,在最大限度保留原始数据主要特征(方差)的同时,有效简化数据结构、降低计算复杂度,并消除变量间的多重共线性。
n个样本m个指标x 1x 2,…,x m,得到原始数据矩阵为
X = x 11 x 12 x 1 m x 21 x 22 x 2 m x n 1 x n 2 x n m
为消除影响因子之间由于单位或者数量级不同造成的误差,即在运用主成分分析法处理之前需对各指标数据进行极差归一化处理,表达式为
y = 2 x i - x m i n x m a x - x m i n - 1
式中: x i x m i n x m a x分别为待处理的样本数据、样本数据的最小值和最大值。
数据处理后,进行主成分分析,获得的新变量y 1y 2,…,ym 可由原来变量x 1x 2,…,xm 线性表示,即:
y 1 = a 11 x 1 + a 12 x 2 + + a 1 m x m y 2 = a 21 x 1 + a 22 x 2 + + a 2 m x m y m = a m 1 x 1 + a m 2 x 2 + + a m m x m
式中:y 1y 2,…,ym 为经主成分分析后的新变量; a 1 l , a 2 l , , a m l l = 1,2 , , m为方程组的系数。以上系数必须满足如下条件:(1) a k 1 2 + a k 2 2 + + a k m 2 = 1 , k = 1,2 , , m;(2) C o v y k , y l = 0 , ( k l ; l = 1,2 , , m),即主成分无信息重叠;(3) v a r y 1 v a r y 2 v a r y m,即主成分重要性依次递减。
由式(7)~式(9)所确定的y 1y 2,…,ym,即为原变量的第1,2,…,m个主成分,其方差在总方差中所占比例依次递减。

3 本文预测方法

基于爆心距特征值并结合PCA-BP神经网络的露天矿爆破振动波形预测模型流程如图2所示,主要步骤如下:
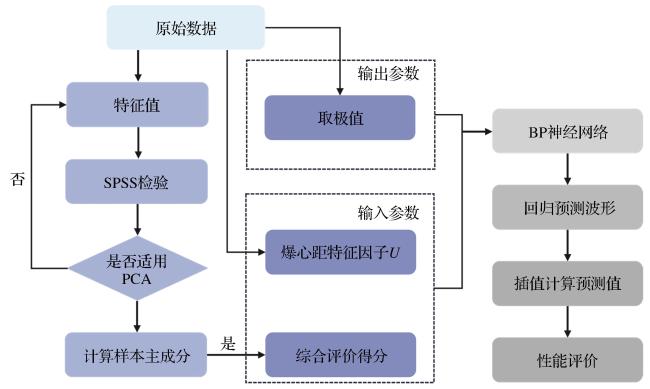
图2 PCA-BP爆破振动信号预测模型的流程图

Fig. 2 Flow chart of PCA-BP blasting vibration signal prediction model

(1)基于一阶差分和符号函数,通过式(1)式(2)对爆破振动波形数据取极值。
(2)根据式(7)定义理想化爆心距特征值U
(3)对爆破振动的特征值进行标准化处理,消除模型性能受到的量纲和单位差异等因素的影响。
(4)通过SPSS进行检验,以验证是否适用主成分分析;选择多个爆破参数进行主成分分析降维。
(5)将综合评价得分与炮孔爆心距特征值U作为数据输入;波形中各时间点所对应的振速取极值后作为输出参数;确定网络结构输入节点数、输出节点数和计算隐含层的节点数,设置BP网络训练参数;输出爆破振动信号波形预测结果。
(6)根据回归预测极值结果,采用3次样条插值(插值间隔根据实际爆破振动持续时间确定)计算出与之相应时刻的预测值[式(11)],最后进行模型性能评价。
S x = a + b ( x - x i ) + c ( x - x i ) 2 + d ( x - x i ) 3
式中:Sx)为插值后对应的爆破振动信号值;abcd为待定系数; x为要插值的振动信号数据;xi 为最接近 x且小于 x的数据点;i为数据点的位置。

4 案例验证分析

4.1 工程一

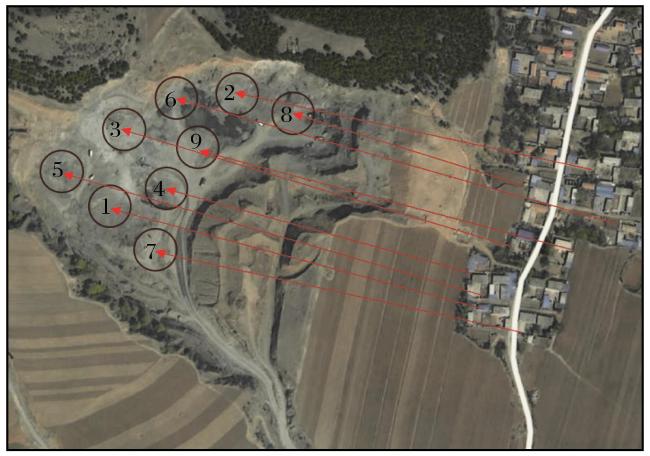
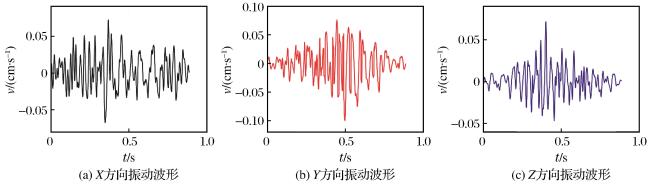
工程一为兆兴矿业有限公司露天矿山,选择代表性的建筑物进行爆破振动监测,其测点布置如图3所示。本工程共采集9次爆破作业的振动数据,其中第9次爆破作业的振动波形图如图4所示。经SPSS验证,得出台阶高度(H)、爆心距(R)、炸药单耗(Q)、孔数(N)和堵塞长度(L)等参数适用主成分分析。
图3 工程一测点布置图

注:序号①~⑨对应 9 次爆破作业,箭头方向为测点至爆区方位

Fig. 3 Layout diagram of measurement points in Project 1

图4 工程一第9次振动波形图

Fig. 4 The ninth vibration waveform diagram of Project 1

(1)振动信号数据处理
首先,基于一阶差分和符号函数,通过式(1)式(2)进行极值提取。然后,利用式(7)引入爆破振动信号的爆心距特征值(U)。
(2)PCA降维处理
通过式(7)构造原数据矩阵[式(12)],利用式(8)对各影响因子数据(表1)进行[1]区间的归一化,结果见表2
X = 8.5 380 3.3 9.5 400 3.4 9.2 451 3.7
表1 工程一的爆破参数数据

Table 1 Blasting parameter data of Project 1

爆破次序 H/m R/m Q/(kg∙m³) N/个 L/m
1 8.5 380 0.72 30 3.3
2 9.5 361 0.70 75 2.9
3 8.5 400 0.74 65 3.4
4 6.0 300 0.76 135 3.0
5 9.2 450 0.66 90 3.7
6 8.5 400 0.80 30 3.3
7 8.5 351 0.74 65 3.4
8 6.0 250 0.76 135 3.0
9 9.2 451 0.66 90 3.7
表2 归一化样本数据

Table 2 Normalized sample data

爆破次序 H R Q N L
1 0.429 0.294 -0.143 -1.000 0.000
2 1.000 0.105 -0.429 -0.143 -1.000
3 0.429 0.493 0.143 -0.333 0.250
4 -1.000 -0.503 0.429 1.000 -0.750
5 0.829 0.990 -1.000 0.143 1.000
6 0.429 0.491 1.000 -1.000 0.000
7 0.429 0.005 0.143 -0.333 0.250
8 -1.000 -1.000 0.429 1.000 -0.750
9 0.829 1.000 -1.000 0.143 1.000
调用SPSS因子分析窗口对归一化后数据进行降维,在描述窗口中选择相关性矩阵得到相关系数矩阵(表3)。提取特征值大于1的因子,得到主成分特征值、方差贡献率和累计方差贡献率。
表3 相关系数矩阵

Table 3 Correlation coefficient matrix

H R Q N L
H 1.000 0.845 -0.583 -0.667 0.543
R 0.845 1.000 -0.590 -0.544 0.822
Q -0.583 -0.590 1.000 -0.088 -0.548
N -0.667 -0.544 -0.088 1.000 -0.291
L 0.543 0.822 -0.548 -0.291 1.000
针对表1中的5个爆破参数,有些因素之间存在较大的线性关系,对上述变量进行主成分分析后提取的因子具有正交性。由表4可以看出,2个影响因子的特征值分别为3.236和1.139,累计方差贡献为87.499%。根据Kaiser准则(特征值大于1),前2个主成分的特征值分别为3.236和1.139,均满足条件,且满足主成分分析的累计贡献率大于85%(温廷新等,2015),表明原始数据87.499%的信息由这2个主成分代表,通过减少维度(从5维降至2维),提高了模型的计算效率。
表4 主成分特征值、贡献率及累计贡献率

Table 4 Principal component eigenvalues, contribution rates, and cumulative contribution rates

序号 特征值 贡献率/% 累计贡献率/%
1 3.236 64.726 64.726
2 1.139 22.773 87.499
3 0.483 9.656 97.156
4 0.096 1.926 99.082
5 0.046 0.918 100.000
调用SPSS软件,可获得主成分得分系数,见表5
表5 工程一的主成分得分系数

Table 5 Principal component score coefficient of Project 1

参数名称 成分
1 2
H 0.283 -0.152
R 0.299 -0.005
Q -0.207 -0.577
N -0.182 0.694
L 0.253 0.201
通过表5得到主成分得分表达式,即:
F 1=0.283x 1+0.299x 2-0.207x 3-0.182x 4+0.253x 5
F 2=-0.152x 1-0.005x 2-0.577x 3+0.694x 4+0.201x 5
式中:x 1x 2x 3x 4x 5为标准化后的值。
(3)波形预测
通过工程一前8次爆破作业振动数据,预测后一次爆破作业振动波形数据。需要说明的是,由于振动信号采样频率不同,本文以不同时刻对应的波形信号作为预测输出层,而非单一波形,因此测试样本量较大。将主成分分析得到的F 1F 2U作为神经网络输入层,取极值后的爆破振动信号数据作为输出层,使用MATLAB平台进行BP神经网络模型训练。最后,将预测模型输出值进行3次样条插值计算得到预测值。

4.2 工程二
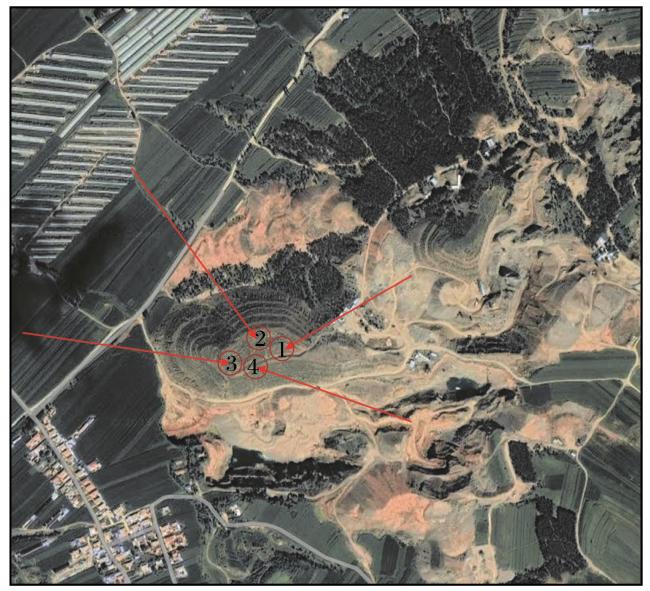
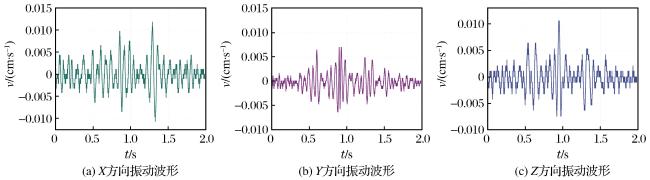
工程二为建平县顺达铁选有限公司露天矿山,其测点布置如图5所示。本研究共采集4次爆破作业的振动波形图,其中第4次爆破作业的振动波形图如图6所示。
图5 工程二测点布置图

注:图中序号①~④分别对应4次爆破作业,一次爆破对应一个测点

Fig. 5 Layout diagram of the measurement points in Project 2

图6 工程二第4次振动波形图

Fig. 6 The fourth vibration waveform diagram of Project 2

与工程一的步骤相同,以实测H、R、Q、NL表6)进行主成分分析,利用SPSS软件对数据进行PCA降维处理,主成分得分系数见表7
表 6 工程二的爆破参数数据

Table 6 Blasting parameter data of Project 2

爆破次序 H/m R/m Q/(kg∙m³) N/个 L/m
1 10.0 212 0.36 28 7.2
2 10.0 336 0.36 28 7.2
3 9.0 336 0.36 20 7.0
4 9.5 212 0.27 36 7.2
表 7 工程二的主成分得分系数

Table 7 Principal component score coefficient of Project 2

参数名称 成分
1 2
H 0.189 -0.566
R -0.252 0.156
Q -0.206 0.516
N 0.300 -0.142
L 0.284 0.284
表7可得主成分得分表达式,即:
F 1=0.189x 1-0.252x 2-0.206x 3+0.3x 4+0.284x 5
F 2=-0.566x 1+0.156x 2+0.516x 3-0.142x 4+0.284x 5
式中:x 1x 2x 3x 4x 5为标准化后的值。
将主成分分析得到的F 1F 2U作为神经网络输入层,取极值后的爆破振动信号数据作为输出层,通过前3次振动数据预测第4次振动波形数据。

4.3 预测结果评价
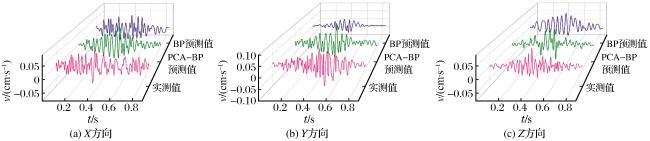
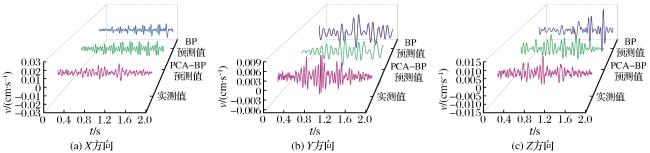
2种工程数据经过BP神经网络波形极值预测之后,通过3次样条插值得到的预测波形数据,与实测原数据及单一BP神经网络预测数据进行对比,图7图8分别为工程一9号测点和工程二4号测点的预测值与实测值的对比。根据均方根误差(MAE)[式(17)]和平均绝对值误差(RMSE)[式(18)]对预测结果进行评价,结果见表8
图7 工程一9号测点对比

Fig. 7 Comparison of No.9 measurement point in Project 1

图8 工程二4号测点对比

Fig. 8 Comparison of No.4 measurement point in Project 2

E M A E = 1 m c = 1 m y c - y y
E R M S E = 1 m c = 1 m y c - y y 2
式中:ycyy 分别为实测值和预测值。
表 8 MAERMSE评价对比

Table 8 Comparison of MAE and RMSE evaluations

工程一 PCA-BP BP 工程二 PCA-BP BP
MAE X方向 0.024 0.029 X方向 0.004 0.004
Y方向 0.026 0.022 Y方向 0.002 0.002
Z方向 0.015 0.021 Z方向 0.002 0.003
RMSE X方向 0.032 0.037 X方向 0.005 0.006
Y方向 0.035 0.031 Y方向 0.002 0.003
Z方向 0.023 0.028 Z方向 0.003 0.004
根据均方根误差(MAE)和平均绝对值误差(RMSE)值越小越好的原则,由表8可知,相较于单一BP法,利用PCA-BP法预测波形具有一定的准确性。BP神经网络展现出良好的学习和映射能力,且具备自学习的特性,能够通过新数据不断优化训练,改进预测模型。而PCA-BP神经网络结合主成分分析法,有效消除了参数间的相关性,从而提升了模型的预测精度,使得PCA-BP神经网络在预测结果上优于BP神经网络。以峰值振速和主频加以评价模型的预测值。峰值振速和主频对比结果见表9表10,相对误差(δ)和绝对误差(E)按式(19)式(20)计算。通过对比可知,PCA-BP神经网络的误差更小,能够更好地体现波形特征。
δ = y y - y c y c × 100 %
E = y y - y c
式中:δ为相对误差;E为绝对误差;ycyy 分别为实测值和预测值。
表 9 峰值振速对比

Table 9 Comparison of peak particle velocity(PPV)

工程

名称

方向 实测值 PCA-BP

相对

误差/%

BP

相对

误差/%

工程一 X 0.072 0.076 5.56 0.062 13.89
Y 0.099 0.105 5.06 0.041 58.59
Z 0.072 0.069 4.17 0.069 4.17
工程二 X 0.014 0.013 10.07 0.012 14.29
Y 0.007 0.007 0.00 0.008 14.28
Z 0.011 0.010 9.09 0.018 63.64
表 10 主频对比

Table 10 Comparison of dominant frequency

工程名称 方向 实测值 PCA-BP

绝对

误差/%

BP

绝对

误差/%

工程一 X 15.79 19.18 3.39 25.96 10.17
Y 12.41 16.92 4.51 18.06 5.65
Z 29.33 23.69 5.64 18.06 11.27
工程二 X 16.13 18.15 2.02 21.68 5.55
Y 18.65 9.07 9.58 7.56 11.09
Z 13.11 12.10 1.01 12.10 1.01
通过对比发现,本文预测值与实测值在总体上具有较高的一致性,波形趋势一致,且峰值振速和主频误差较小,能够反映振动波形趋势,说明该预测方法具有一定的可靠性。
不同工程下的地质条件各异,每次爆破参数可能存在一定的差异性。本研究利用前几次爆破作业预测后一次爆破作业的振动,即测点的地质条件不发生变化,每个测点测多次爆破作业振动,利用前几次爆破振动数据预测该测点下一次的振动数据。因此,在新的工程条件下,检验选取的爆破参数是否适用主成分分析,然后对新的爆破参数进行主成分分析,基于历史测点振动数据对新爆破作业振动进行预测。

5 结论

(1)由于一段爆破振动,采样频率不同,振动波形信号值较多,很难通过某个特征对应某一点的振动信号。本文定义爆心距特征值,使爆心距特征值与爆破振动波形中不同时刻的振速存在对应关系,为后续构建的预测模型提供对应的输入参数。
(2)利用主成分分析法(PCA)消除输入参数间的多重共线性问题,实现了高维特征空间的优化重构。该方法在降低数据维度的同时,有效简化了神经网络结构,使输入节点数减少,相较传统方法其预测精度提升,验证了特征降维对提升模型泛化能力的显著作用。
(3)选取综合评价得分和爆心距特征值U作为输入参数,波形中各时间点所对应的振速作为输出参数,可通过插值计算得出预测波形。结果表明,对于均方根误差(MAE)和平均绝对值误差(RMSE),PCA-BP相较于BP更接近0,且PCA-BP预测的峰值振速相对误差均小于11%,主频绝对误差均小于10 Hz,其预测结果的准确度更高。该预测方法能够准确地反映振动波形趋势及波形特征,有效减少因振动超限导致的设备、建筑损坏,为矿山的爆破安全管理提供技术方案。

四川探明省内最大金矿

11月26日,四川省地质局下属第十地质大队承担的“四川省松潘县东北寨金矿床勘探”项目顺利取得四川省矿产资源储量评审中心出具的矿产资源量评审意见书。项目本次评审新增金资源量28.24 t,累计查明金资源量81.06 t,矿床金平均品位为3.75×10⁻⁶,规模达到特大型,是截至目前四川完成备案的资源量最大的金矿。

东北寨金矿于20世纪70年代被发现,历经几代四川地质人的深耕不辍、持续攻坚,累计施工钻探近10×104 m、坑道超4 000 m,采集各类样品35 000件,最终实现找矿重大突破。东北寨金矿的区位优势明显,开发利用前景良好,具有显著的经济开发价值和战略意义。

本次勘探过程中,四川省第十地质大队高度重视科技创新带动找矿突破,同步开展了东北寨金矿成矿作用研究及成矿预测、深部矿体深穿透地球化学探测方法试验、构造作用与成矿关系研究、地质—物探模型建立及深部预测研究等多个专项课题,从构造动力学特征、矿物学特征、深部地球化学特征和地球物理特征等多个维度研究成矿期次、成矿物质来源和构造控矿特征,进一步总结“东北寨式”微细浸染型金矿的成矿规律,建立了找矿模型。同时开展了选矿探索试验,突破了该矿区高砷高碳金矿石选矿技术难关,为一下步矿床开发利用奠定了基础。

黄金是重要的全球性战略资源,对增强国家对抗金融风险的能力,维护国家经济和金融安全具有重要意义。东北寨金矿床的探获改变了全省金矿勘查开发传统格局,为打造川西地区金矿战略基地提供了资源保障,大力提升了四川在全国金矿领域的战略地位,也为我国同类型矿床勘查提供了重要经验和示范。

矿业界)

http://www.goldsci.ac.cn/CN/10.11872/j.issn.1005-2518.2025.06.018

Álvarez-Vigil A E González-Nicieza C López Gayarre F,et al,2012.Predicting blasting propagation velocity and vibration frequency using artificial neural networks[J].International Journal of Rock Mechanics and Mining Sciences,55:108-116.

Anderson D A Ritter A P Winzer S R,et al,1985. A method for site-specific prediction and control of ground vibration from blasting[C]//Proceedings of the First Mini-Symposium on Explosives and Blasting Research. San Diego: Society of Explosives Engineers.

Bakhshandeh A H Mozdianfard M R Siamaki A2010.Predicting of blasting vibrations in Sarcheshmeh copper mine by neural network[J].Safety Science48(3):319-325.

Blair D P2008.Non-linear superposition models of blast vibration[J].International Journal of Rock Mechanics and Mining Sciences45(2):235-247.

Dindarloo S R2015.Prediction of blast-induced ground vibrations via genetic programming[J].International Journal of Mining Science and Technology25(6):1011-1015.

Dong L J Li X B Xu M,et al,2011.Comparisons of random forest and support vector machine for predicting blasting vibration characteristic parameters[J].Procedia Engineering,26:1772-1781.

Ghasemi E Ataei M Hashemolhosseini H2013.Development of a fuzzy model for predicting ground vibration caused by rock blasting in surface mining[J].Journal of Vibration and Control19(5):755-770.

Khandelwal M Singh T N2009.Prediction of blast-induced ground vibration using artificial neural network[J].International Journal of Rock Mechanics and Mining Sciences46(7):1214-1222.

Singh T N Dontha L K Bhardwaj V2008.Study into blast vibration and frequency using ANFIS and MVRA[J].Mining Technology117(3):116-121.

陈秋松,张钦礼,陈新,等,2016.基于GRA-GEP的爆破峰值速度预测[J].中南大学学报(自然科学版)47(7):2441-2447.

Chen Qiusong Zhang Qinli Chen Xin,et al,2016.Prediction of blasting-vibration-peak-speed based on GRA-GEP[J].Journal of Central South University (Science and Technology)47(7):2441-2447.

陈士海,初少凤,宫嘉辰,等,2022.高地应力下砂岩隧道围岩爆破振动响应研究[J].振动与冲击41(17):73-80,92.

Chen Shihai Chu Shaofeng Gong Jiachen,et al,2022.Blasting vibration response of sandstone tunnel surrounding rock under high ground stress[J].Journal of Vibration and Shock41(17):73-80,92.

费鸿禄,左壮壮,蒋安俊,等,2023.基于KS-GS-SVR的峰值爆破振速预测[J].工程爆破29(2):120-128.

Fei Honglu Zuo Zhuangzhuang Jiang Anjun,et al,2023.Prediction of peak blasting vibration velocity based on KS-GS-SVR[J].Engineering Blasting29(2):120-128.

雷振,2015.台阶爆破振动效应非线性预测方法研究及应用[D].北京:中国矿业大学(北京).Lei Zhen,2015.Research and application on nonlinear prediction methods of bench blasting vibration effect[D].Beijing:China University of Mining & Technology,Beijing.

李洪超,韩昊轩,李胜林,等,2025.台阶单孔爆破振动预测模型的构建与参数确定[J].岩土工程学报47(12):2652-2662.

Li Hongchao Han Haoxuan Li Shenglin,et al,2025.Construction and parameter determination of bench blasting vibration prediction model[J].Chinese Journal of Geotechnical Engineering47(12):2652-2662.

李启月,肖宇航,魏快快,等,2024.露天边坡体爆破振动特性研究[J].黄金科学技术32(3):491-500.

Li Qiyue Xiao Yuhang Wei Kuaikuai,et al,2024.Characterization of blasting vibration in open slopes[J].Gold Science and Technology32(3):491-500.

廖晓目,2023.高陡边坡微差爆破振动主动控制与频谱特征研究[D].长沙:中南大学.Liao Xiaomu,2023.Study on active control and spectrum characteristics of millisecond blasting vibration in high and steep slope[D].Changsha:Central South University.

刘小鸣,陈士海,2020.群孔微差爆破的地表振动波形预测及其效应分析[J].岩土工程学报42(3):551-560.

Liu Xiaoming Chen Shihai2020.Prediction of surface vibration waveforms and analysis of their effects in group-hole differential blasting[J].Chinese Journal of Geotechnical Engineering42(3):551-560.

楼矗云,刘军,蓝鹏,2017.基于样条插值的爆破振动时域波形预测方法[J].工程爆破23(2):24-31.

Lou Chuyun Liu Jun Lan Peng2017.A predicting method for time domain waveform of blasting vibration based on spline interpolation [J].Engineering Blasting23(2):24-31.

施建俊,李庆亚,张琪,等,2017.基于Matlab和BP神经网络的爆破振动预测系统[J].爆炸与冲击37(6):1087-1092.

Shi Jianjun Li Qingya Zhang Qi,et al,2017.Forecast system for blasting vibration velocity peak based on Matlab and BP neural network[J].Explosion and Shock Waves37(6):1087-1092.

王佳信,周宗红,李克钢,等,2017.一种冲击地压危险性等级多参量辨识模型及应用[J].煤炭学报42():311-322.

Wang Jiaxin Zhou Zonghong Li Kegang,et al,2017.A multi-parameter identification model for classification of rock burst risk and its application[J].Journal of China Coal Society42():311-322.

王帅,2022.基于麻雀搜索算法优化的BP神经网络爆破振速峰值预测研究[D].阜新:辽宁工程技术大学.Wang Shuai,2022.Prediction of blasting vibration velocity peak value based on BP neural network optimized by sparrow search algorithm[D].Fuxin:Liaoning Technical University.

王勇,唐旭,邹飞,等,2017.爆破振动特征参量的SVM及神经网络预测应用研究[J].公路62(4):12-17.

Wang Yong Tang Xu Zou Fei,et al,2017.Research on application of blasting vibration characteristic parameters by SVM and predicting of neural network[J].Highway62(4):12-17.

温廷新,朱成伟,孔祥博,2015.基于PCA-ELM模型的露采爆破振动对民房破坏的预测分析[J].中国安全生产科学技术11(8):119-125.

Wen Tingxin Zhu Chengwei Kong Xiangbo2015.Predicting analysis on damage to residential house by blasting vibration in open pit mining based on PCA-ELM model [J].China Safety Production Science and Technology11(8):119-125.

徐芳妹,唐健,2014.爆破振动波形预测模型及应用[J].山西建筑40(27):35-37.

Xu Fangmei Tang Jian2014.The prediction model and application of blasting vibration waveform [J].Shanxi Architecture40(27):35-37.

徐全军,毛志远,张庆明,1998.深孔微差爆破震动预报浅析[J].爆炸与冲击,(2):87-91.

Xu Quanjun Mao Zhiyuan Zhang Qingming1998.The analysis of ground vibration prediction of delay-fired bench blasting [J].Explosion and Shock Waves,(2):87-91.

燕永峰,陈士海,张安康,等,2011.爆破振动信号波形预测模型的优化研究[J].爆破28(1):23-27.

Yan Yongfeng Chen Shihai Zhang Ankang,et al,2011.Optimization research on waveform prediction model of blasting vibration signal[J].Blasting28(1):23-27.

张鹏飞,袁永,何运华,等,2025.基于GRA-EPSO-SVM模型的露天矿山爆破振动速度预测[J].煤炭科学技术53(7):105-115.

Zhang Pengfei Yuan Yong He Yunhua,et al,2025.Blasting vibration velocity prediction of open pit mines based on GRA-EPSO-SVM model[J].Coal Science and Technology53(7):105-115.

赵红梦,姜志侠,2020.PCA-BP算法在地面爆破振动中的应用[J].工程爆破26(5):30-35.

Zhao Hongmeng Jiang Zhixia2020.Application of PCA-BP algorithm in ground blasting vibration [J].Engineering Blasting26(5):30-35.

郑皓文,赵根,胡英国,等,2018.基于ACOR-LSSVM算法的爆破振动速度预测[J].爆破35(3):154-158.

Zheng Haowen Zhao Gen Hu Yingguo,et al,2018.Blasting vibration velocity prediction based on ACOR-LSSVM algorithm[J].Blasting35(3):154-158.

Outlines

/